Chart of the Day
What just did something it almost never does
Every session, a scanner sweeps all of our datasets — 300+ market and macro series — for readings that are extreme against their own full history: record highs and lows, decade extremes, regime flips. We verify the numbers against the source data, chart the ones worth your attention, and link each to the live gauge it came from. These are the charts we post on X and in the research letter.
Wednesday, October 7, 2026
3 charts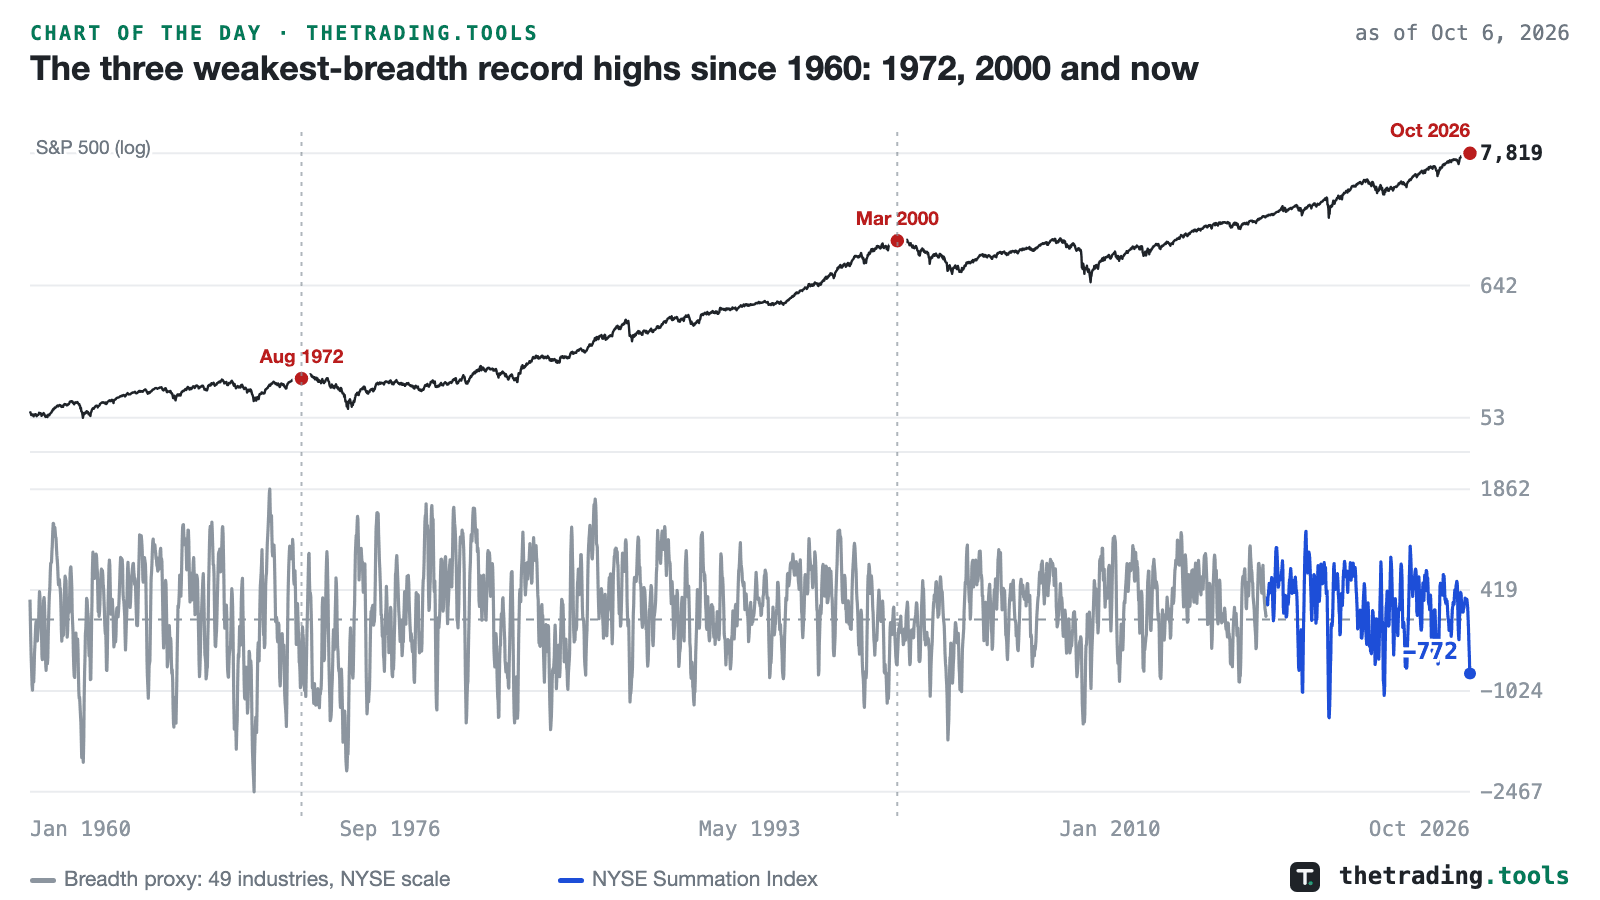
The three weakest-breadth record highs since 1960: 1972, 2000 and now
SPY closed at $779.09 on October 6, 2026, a record, above its August 13 close of $777.88. On the same day the ratio-adjusted McClellan Summation Index for NYSE common stocks stood at −772. The index adds up the McClellan Oscillator, the gap between a fast and a slow average of the day’s advances minus declines, so it falls when more stocks decline than advance for weeks at a time. Of SPY’s 326 record closes since April 2017, October 6 is the only one with the index below −700, and the weakest before it was −310 on December 27, 2021.
as of Oct 6, 2026 close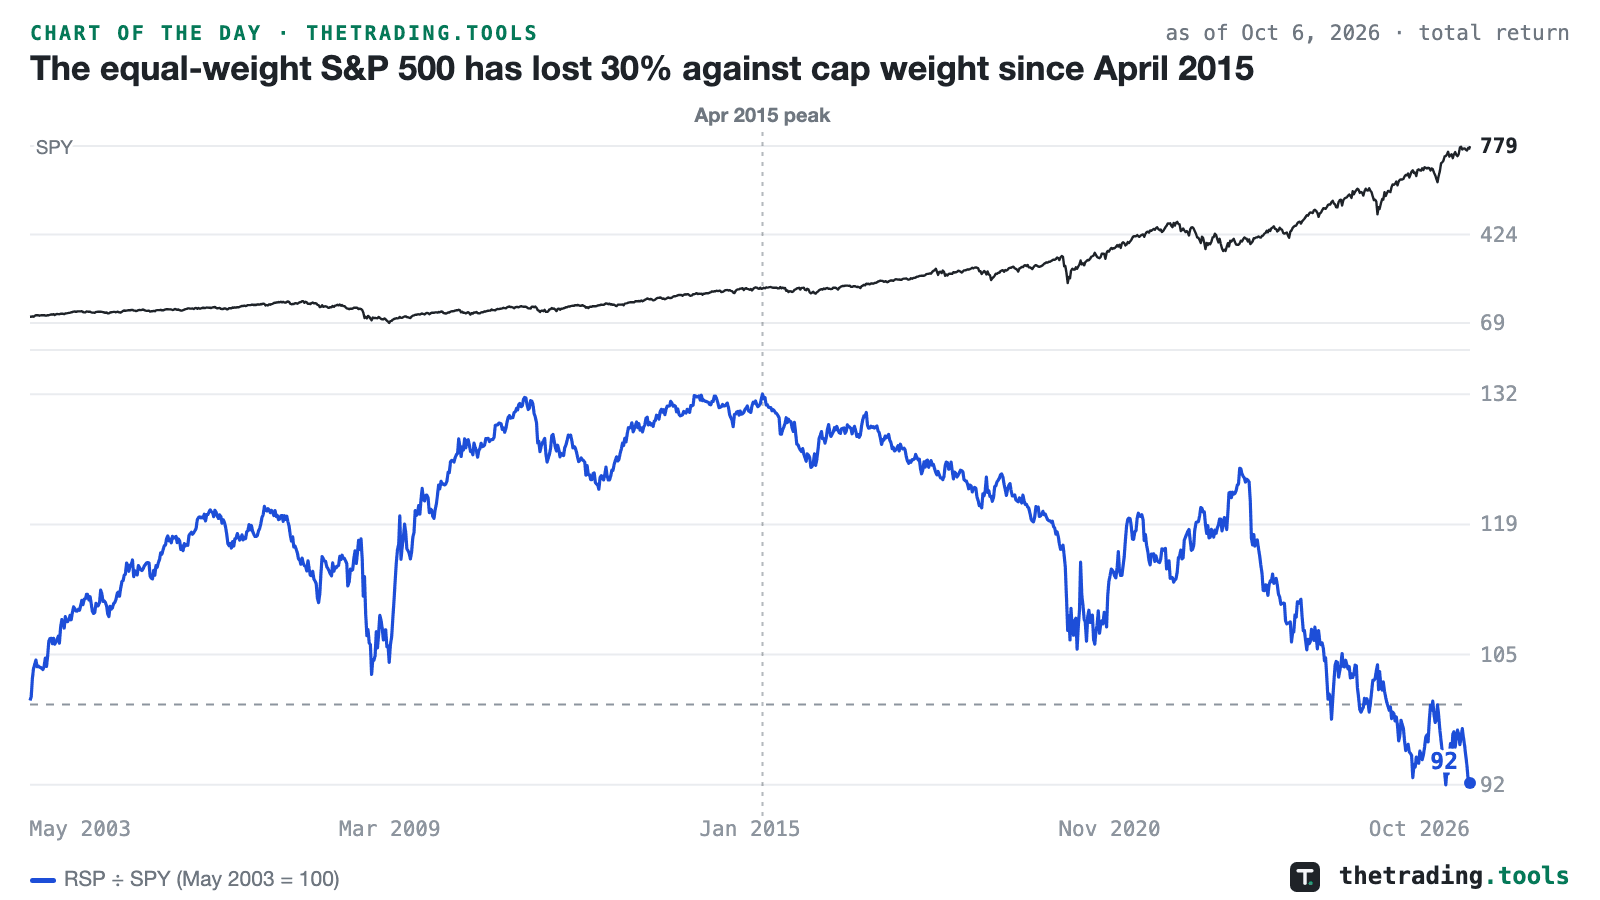
The equal-weight S&P 500 has lost 30% against cap weight since April 2015
The equal-weight S&P 500, held through RSP, has lost 30.4% against the cap-weighted index, held through SPY, since April 6, 2015, counting dividends on both sides. Over the last three years it has lost 15.4%, and over the last year 3.8%. In weekly closes the ratio is just above its lowest reading since RSP launched in 2003, set on May 15, 2026. Both funds hold the same 500 companies. The difference is weighting: in SPY the largest companies count for most of the result, and in RSP each counts the same.
as of Oct 6, 2026 close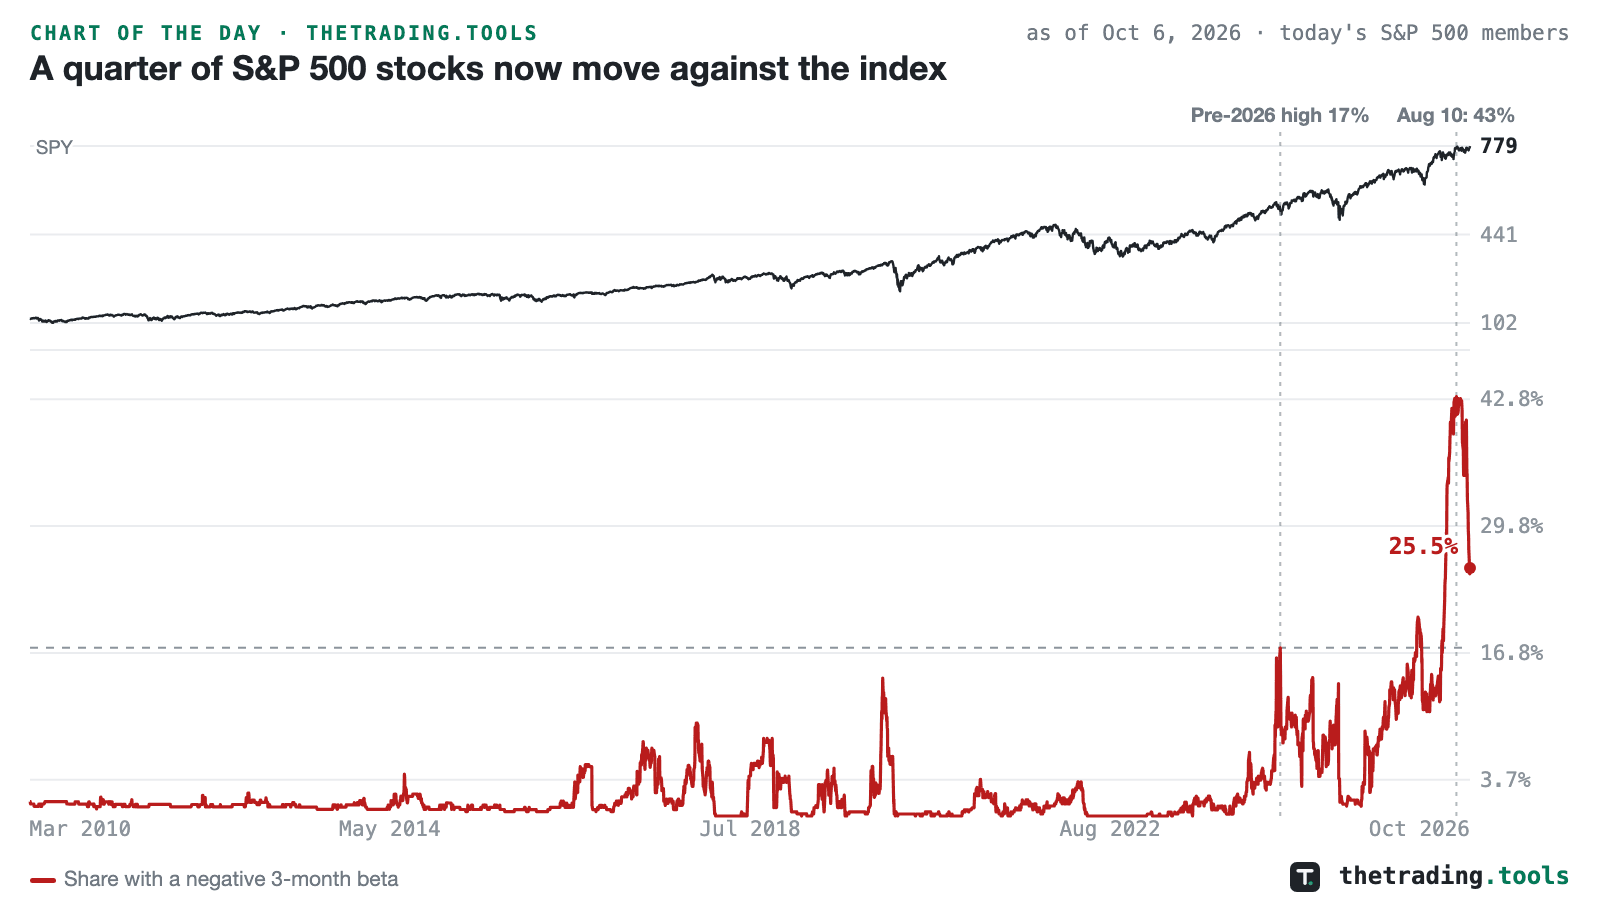
A quarter of S&P 500 stocks now move against the index
On October 6, 2026, 25.5% of the 494 S&P 500 members in our data had a negative beta to the index over the last three months: they tended to rise on SPY’s down days and fall on its up days. The median since 2010 is 1.2%, and before 2026 the high was 17.3% in August 2024. The share peaked at 43.1% on August 10 and has fallen since, but it is still above any reading before this year. The slower one-year measure, built on weekly returns, is 18.7%, against a record of 18.9% set in July.
as of Oct 6, 2026 closeSunday, September 20, 2026
3 charts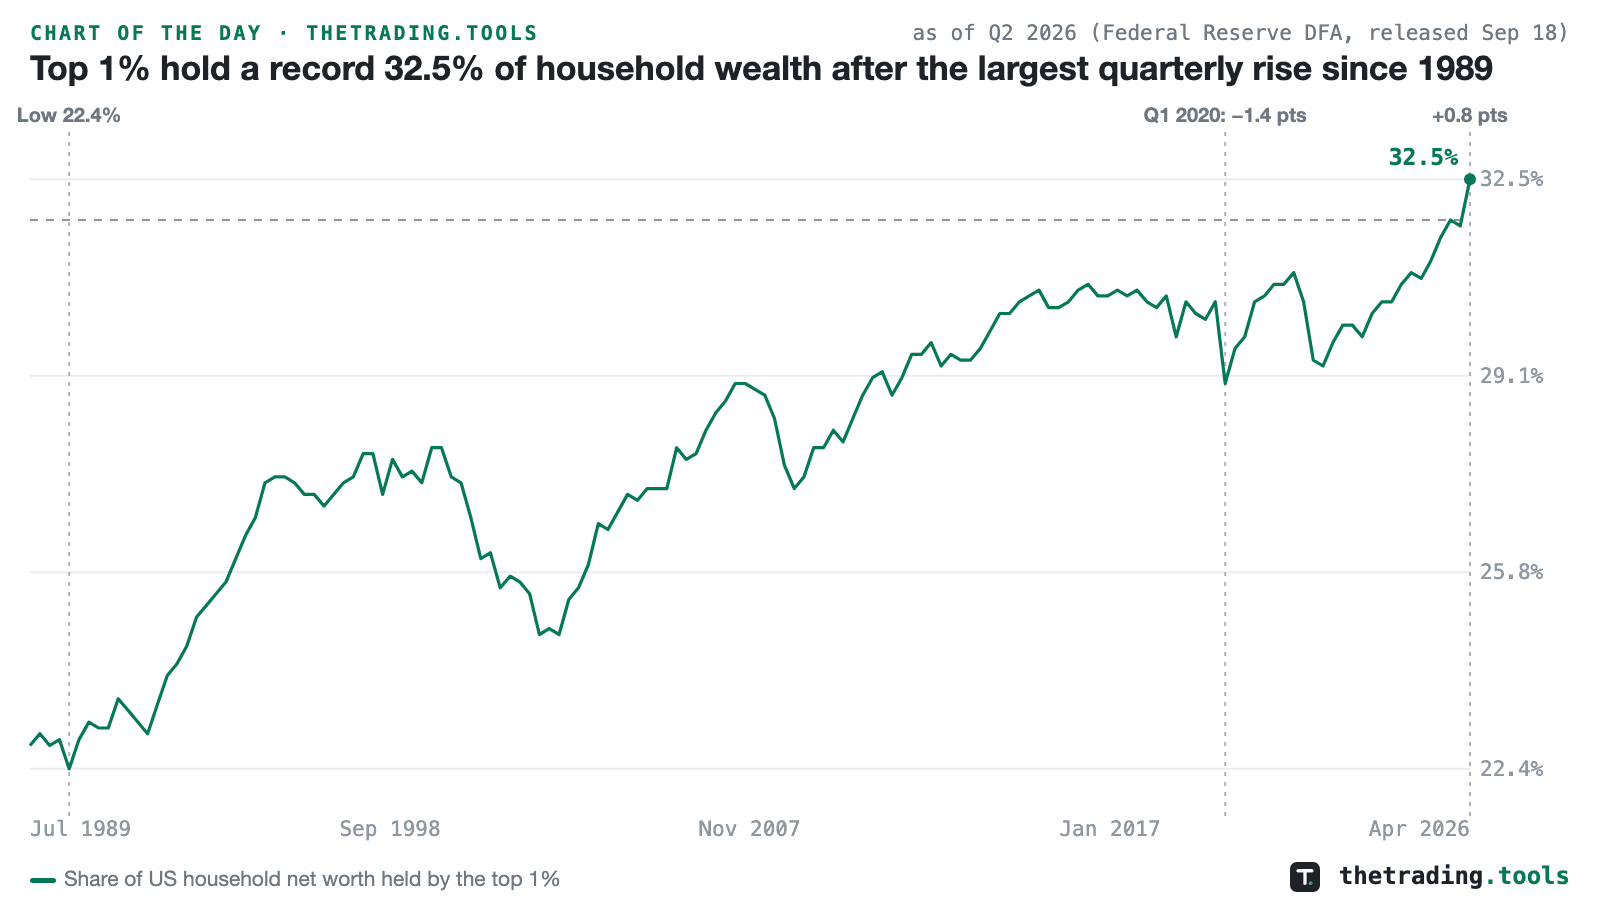
Top 1% hold a record 32.5% of household wealth after the largest quarterly rise since 1989
The Federal Reserve’s Distributional Financial Accounts, released September 18, 2026, put the share of US household net worth held by the wealthiest 1% at 32.5% in the second quarter of 2026. That is the highest reading in a series that begins in the third quarter of 1989, above the prior record of 31.8% set in the fourth quarter of 2025. The share rose 0.8 points from 31.7% in the first quarter, the largest quarterly increase among the 147 quarterly changes in the record; the previous largest were 0.7 points, in the first quarters of 2004 and 2006. The low was 22.4% in the third quarter of 1990, 10.1 points below where it stands now.
as of Q2 2026 (released Sep 18, 2026)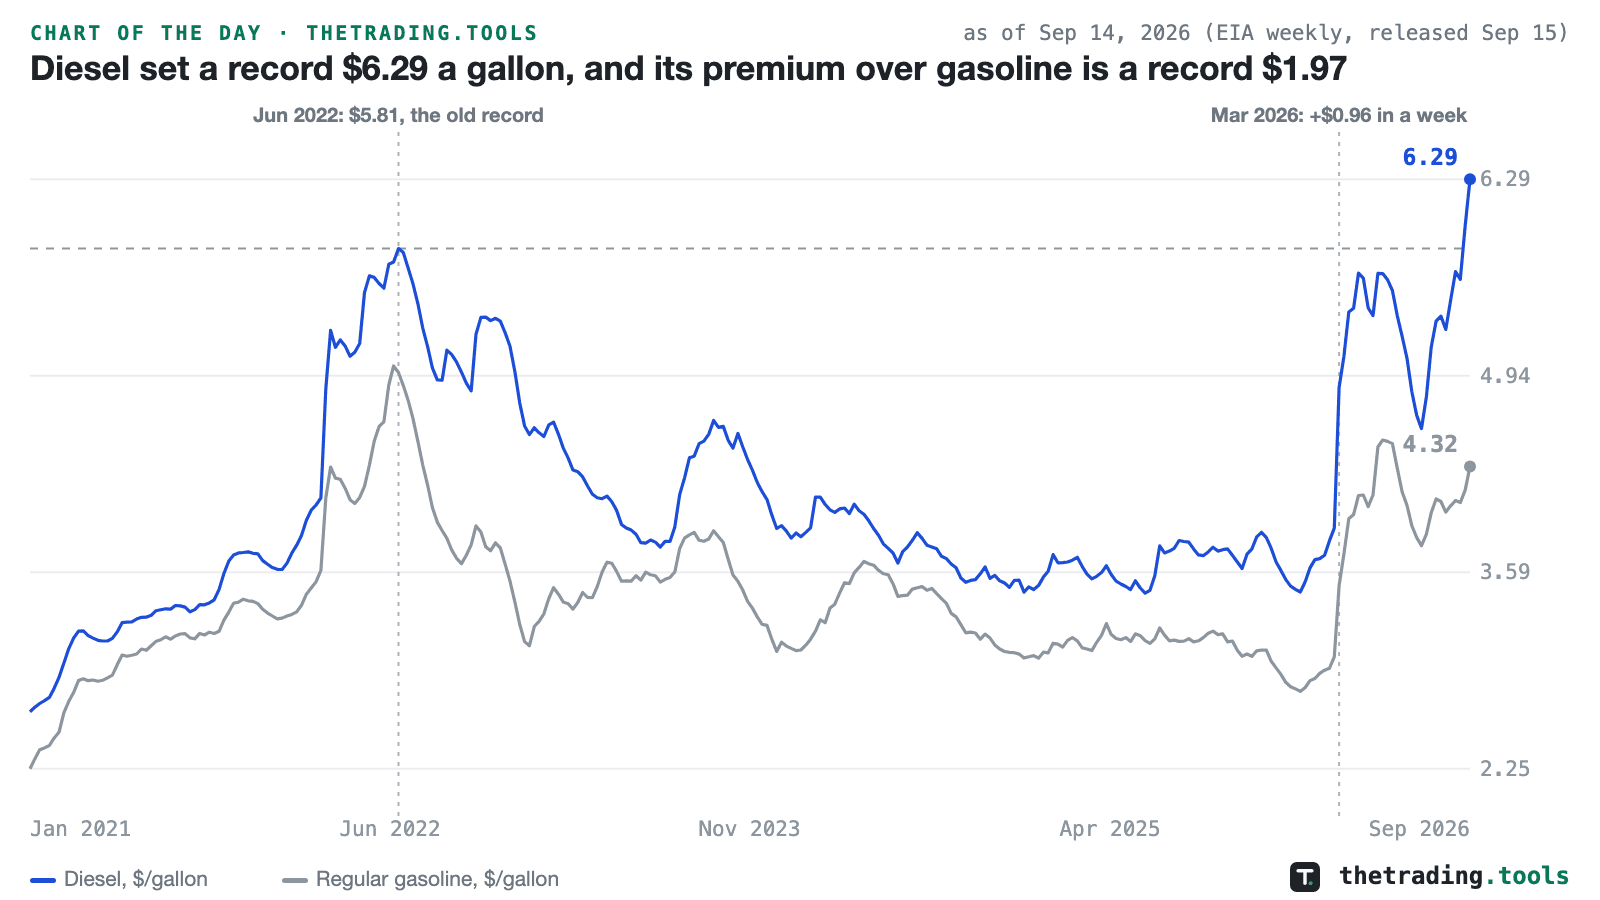
Diesel set a record $6.29 a gallon, and its premium over gasoline is a record $1.97
The national average retail price of diesel was $6.285 a gallon on September 14, 2026, in the Energy Information Administration’s weekly survey. That is the highest reading in a series that begins in March 1994 and the first above $6. The old record, $5.81 on June 20, 2022, stood until the week before, when diesel reached $5.967; the new figure is 8.2% above it. Diesel has risen $0.686 in two weeks, is up 79.6% from $3.50 at the end of 2025 and up 68.1% from $3.739 a year earlier. The largest weekly increase in the record also belongs to this year: $0.962 in the week of March 9.
as of Sep 14, 2026 (released Sep 15)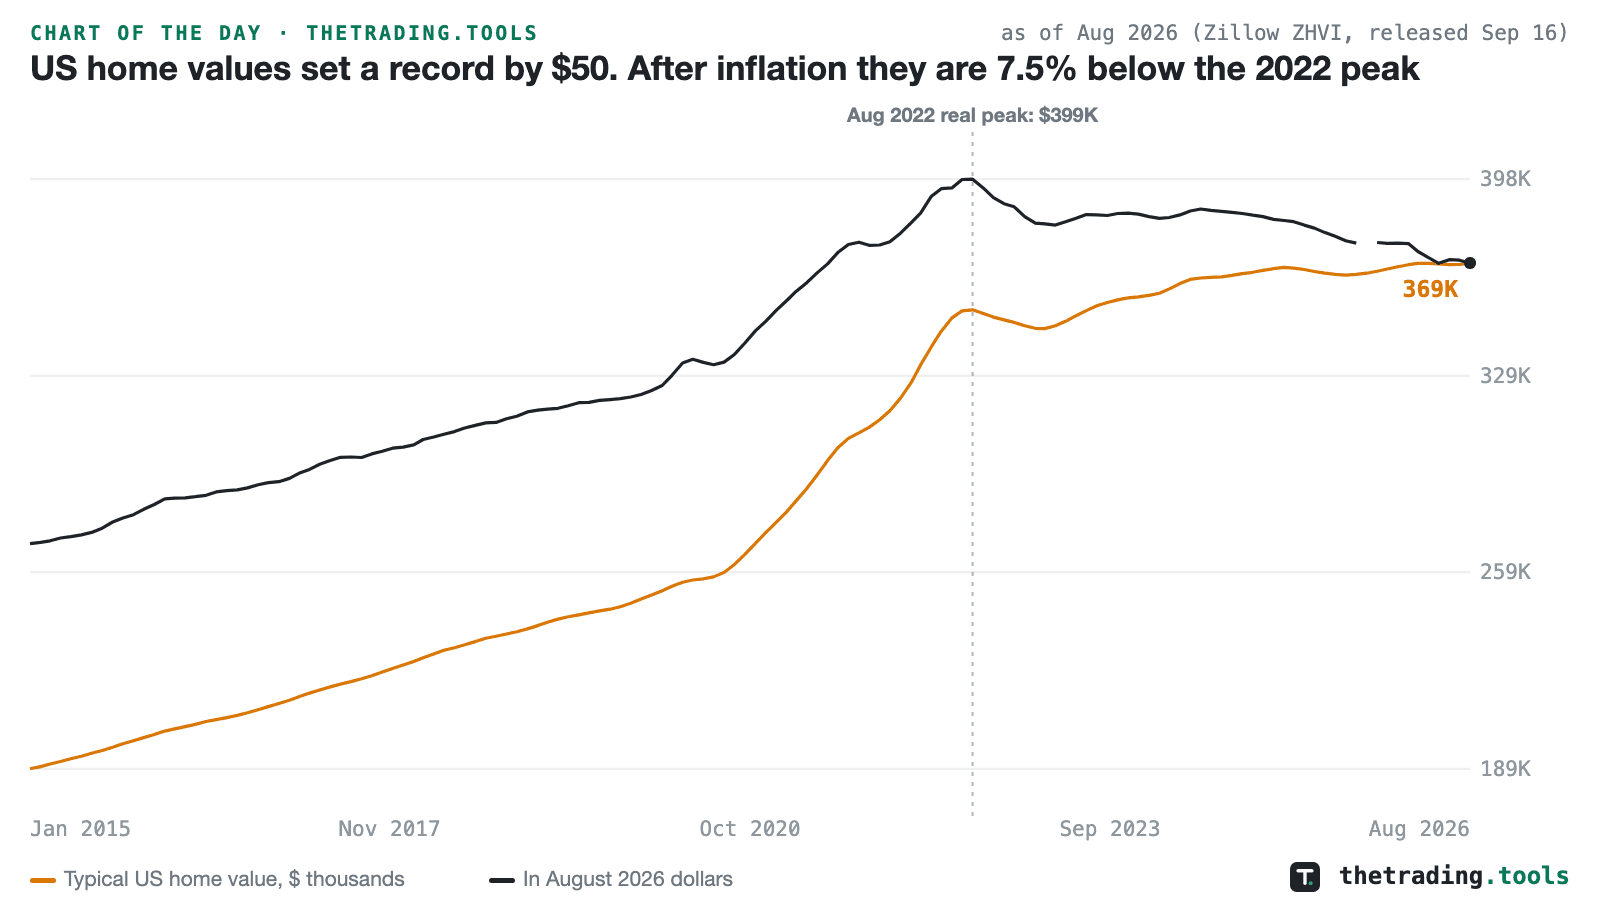
US home values set a record by $50. After inflation they are 7.5% below the 2022 peak
Zillow’s Home Value Index put the typical US home at $368,697 in August 2026, in data released September 16. That is the highest reading in a series that begins in January 2000, and it beat the previous record, $368,647 in April, by $50. In between, the index slipped to $368,142 in June. Over twelve months it is up 1.2%, while consumer prices rose 3.4%. The typical home is worth 46.1% more than in February 2020.
as of Aug 2026 (released Sep 16, 2026)Thursday, September 10, 2026
3 charts
Margin debt fell $84.8 billion in July, the largest monthly drop on record
FINRA’s customer margin balances fell to $1,417,225 million in July 2026 from a record $1,502,072 million in June, a change of $84,847 million. That is the largest negative month in the series, which begins in January 1997; the prior record was $80,384 million in January 2022. It follows the two largest monthly increases on record, $111,276 million in May and $86,515 million in June, so the July figure removes about one month of the spring’s borrowing. Year on year the balance was up 49.0% in June and is up 38.6% in July.
as of Jul 2026 (FINRA, released Sep 10, 2026)
Health care fell 4.2% in five sessions while tech rose 0.9%
Over the five sessions from September 2 to September 10, 2026, the Health Care Select Sector SPDR (XLV) fell 4.22% while the Technology Select Sector SPDR (XLK) rose 0.88%. The 5.10-point gap between the two five-session returns sits at the 3.4th percentile of 6,931 such windows since the two funds’ shared history began in February 1999, meaning fewer than one week in twenty-five has seen health care lag technology by this much.
as of Sep 10, 2026
Four large caps closed at 52-week lows with the S&P 500 2.6% from its high
Six large companies closed at their lowest price of the trailing 252 sessions on September 10, 2026. McDonald’s closed at $253.05, 25.8% below its 52-week high and its lowest close since July 26, 2024. Lowe’s closed at $196.56, 31.6% below its high and its lowest since November 13, 2023. Stryker closed at $270.01, 30.6% below its high, its lowest since October 30, 2023 and its eighth straight down close. CRH closed at $87.66, 33.3% below its high; HDFC Bank at $21.84, 41.3% below its high and its lowest since June 2020; Brookfield at $38.05, 22.6% below its high. Royal Caribbean and ELS are each on twelve straight down closes without reaching a 52-week low.
as of Sep 10, 2026Friday, September 4, 2026
3 charts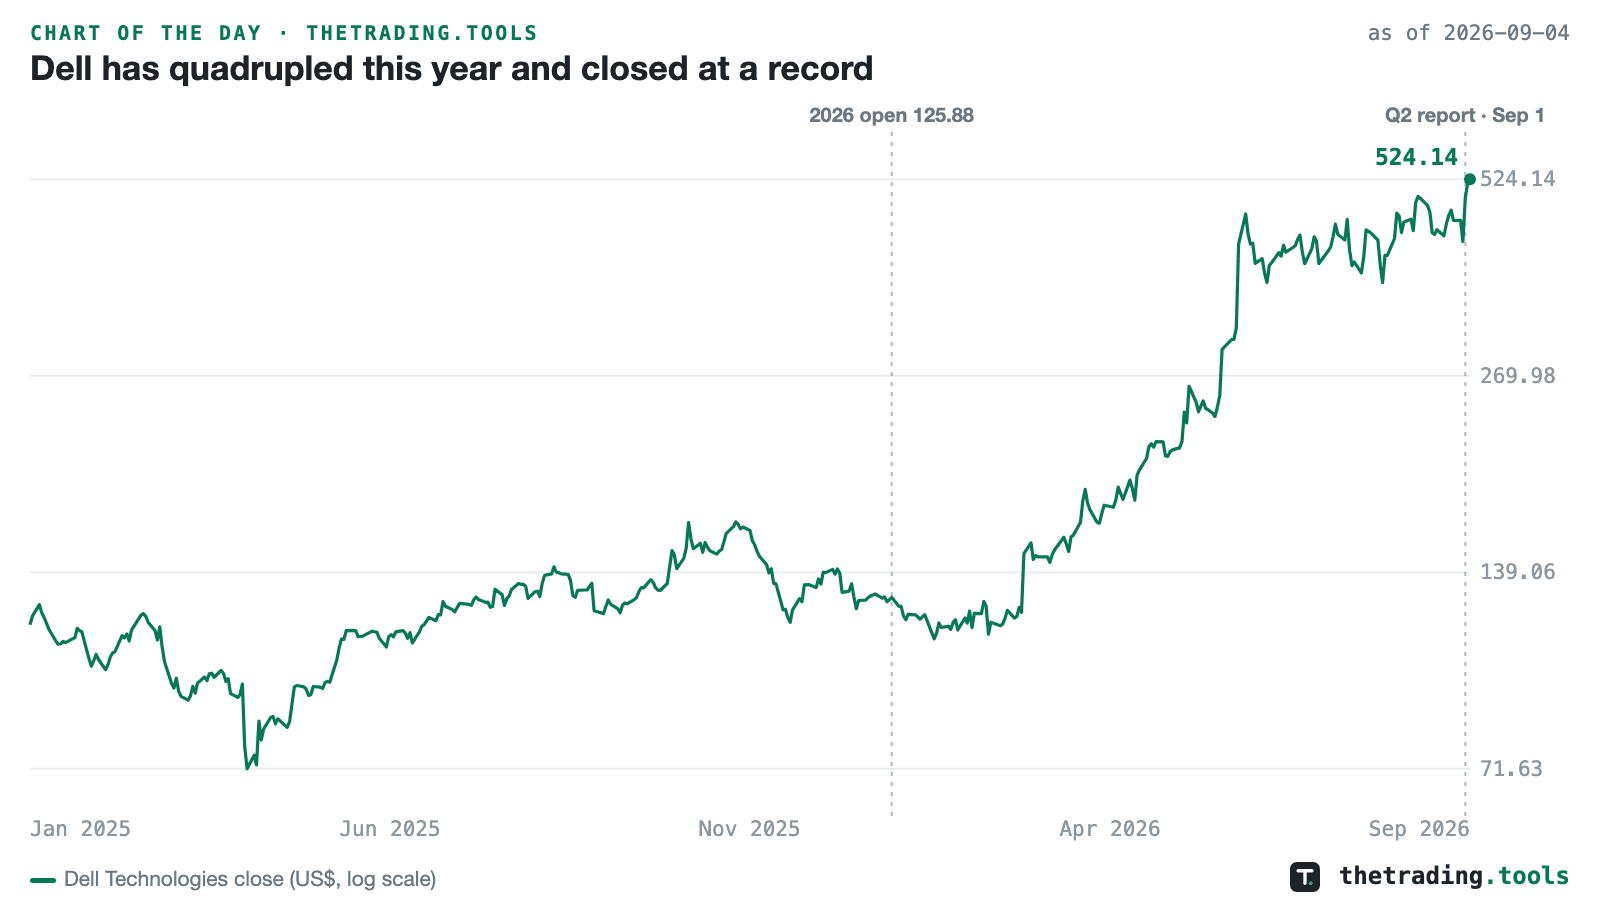
Dell has quadrupled this year and closed at a record
Dell Technologies closed at $524.14 on September 4, 2026, the highest close in a price record that begins in August 2016. It ended 2025 at $125.88, so the stock is up 316% this year, and 15.0% of that came this week. The report published after the September 1 close was priced on September 2, when the stock rose 15.9% in a session: revenue of $47.0 billion, up 58% from a year earlier, and a record $60.9 billion of orders for AI servers, with the company raising its full-year revenue guidance by $25 billion to $192 billion.
as of Sep 4, 2026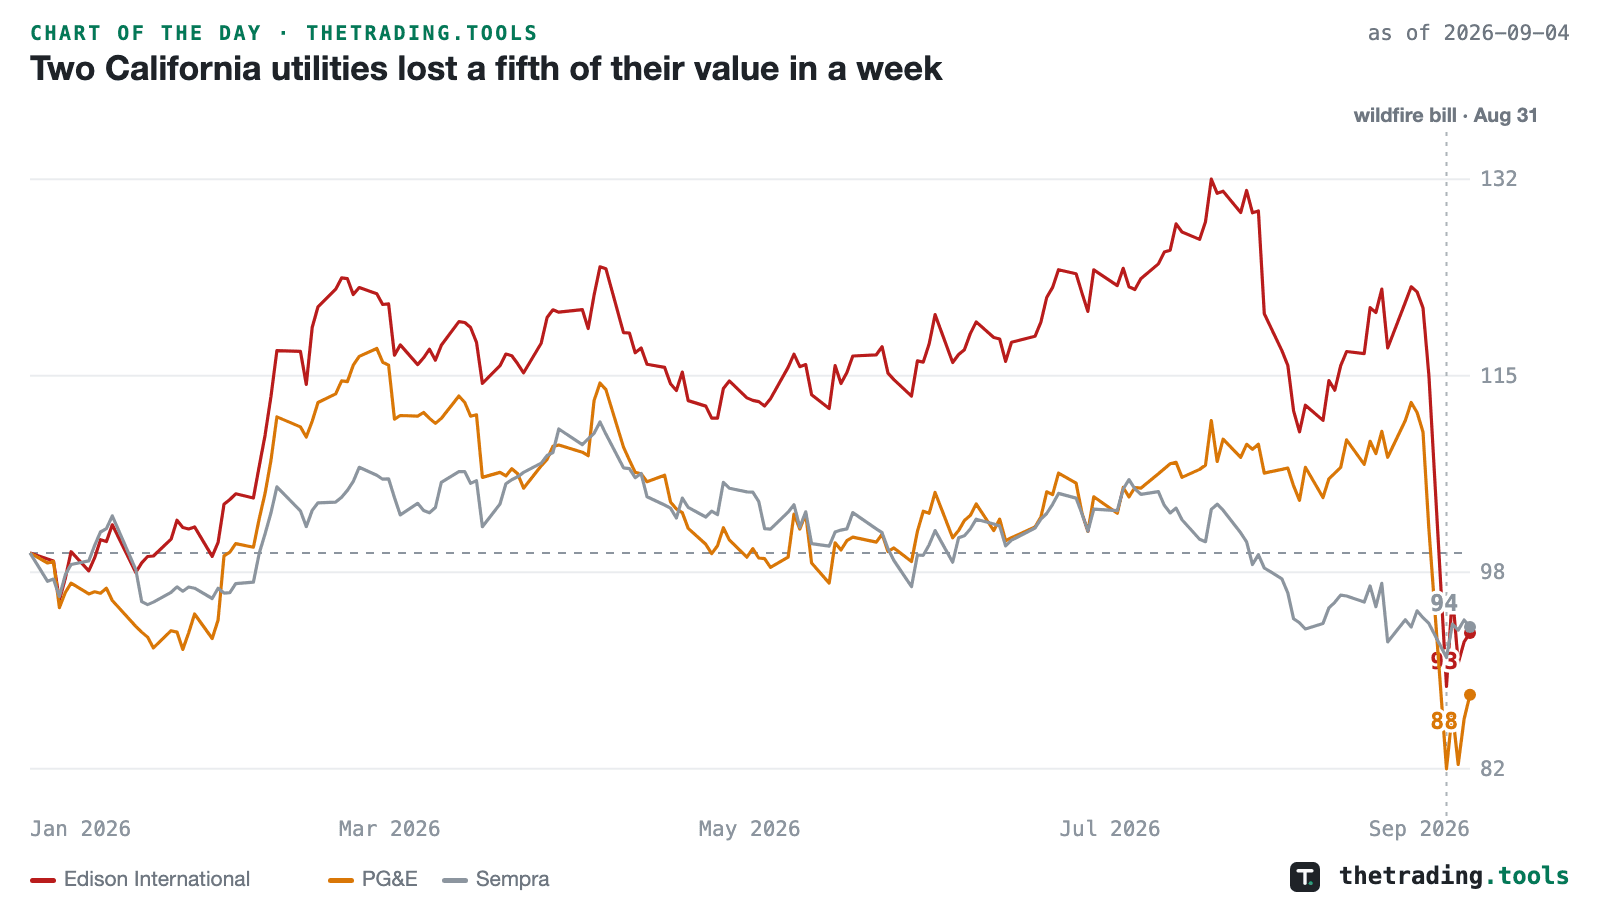
Two California utilities lost a fifth of their value in a week
Edison International closed at $56.77 on September 4, 2026, 19.1% lower than a week earlier and 29.4% below its 52-week high. PG&E closed at $14.30, 13.9% lower on the week and 25.2% below its high. Most of both moves came on Monday, August 31, when Edison fell 23.1% and PG&E 20.1% in a single session after an amended wildfire-liability bill, SB 492, was published. The Assembly let the bill die on September 1, and on September 2 PG&E announced a strategic review and deferred about $2 billion of its 2027 capital spending.
as of Sep 4, 2026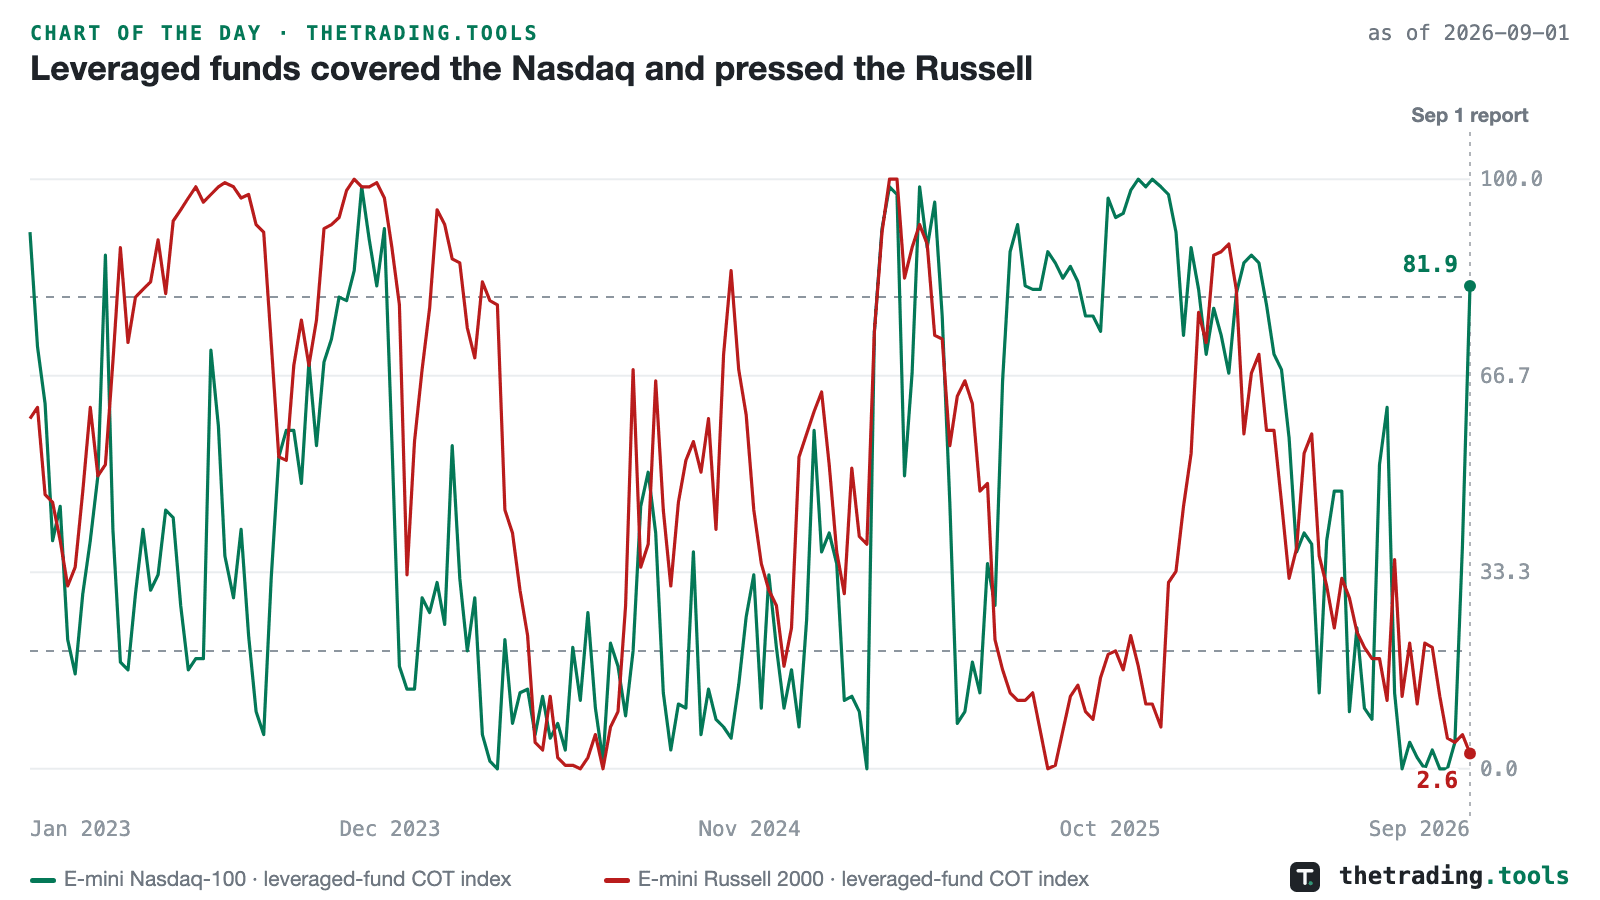
Leveraged funds covered the Nasdaq and pressed the Russell
In the Commitments of Traders report for positions as of Tuesday, September 1, 2026, leveraged funds bought back 27,140 contracts of E-mini Nasdaq-100 exposure, cutting a net short of 41,232 contracts to 14,092. Against 1,055 weekly changes in the record, that is the 92nd percentile by absolute size, and it took the group’s COT index, which places the current net position inside its three-year range, from 38.1 to 81.9 in one report.
as of Positions as of Sep 1, 2026 (released Sep 4)Thursday, September 3, 2026
3 charts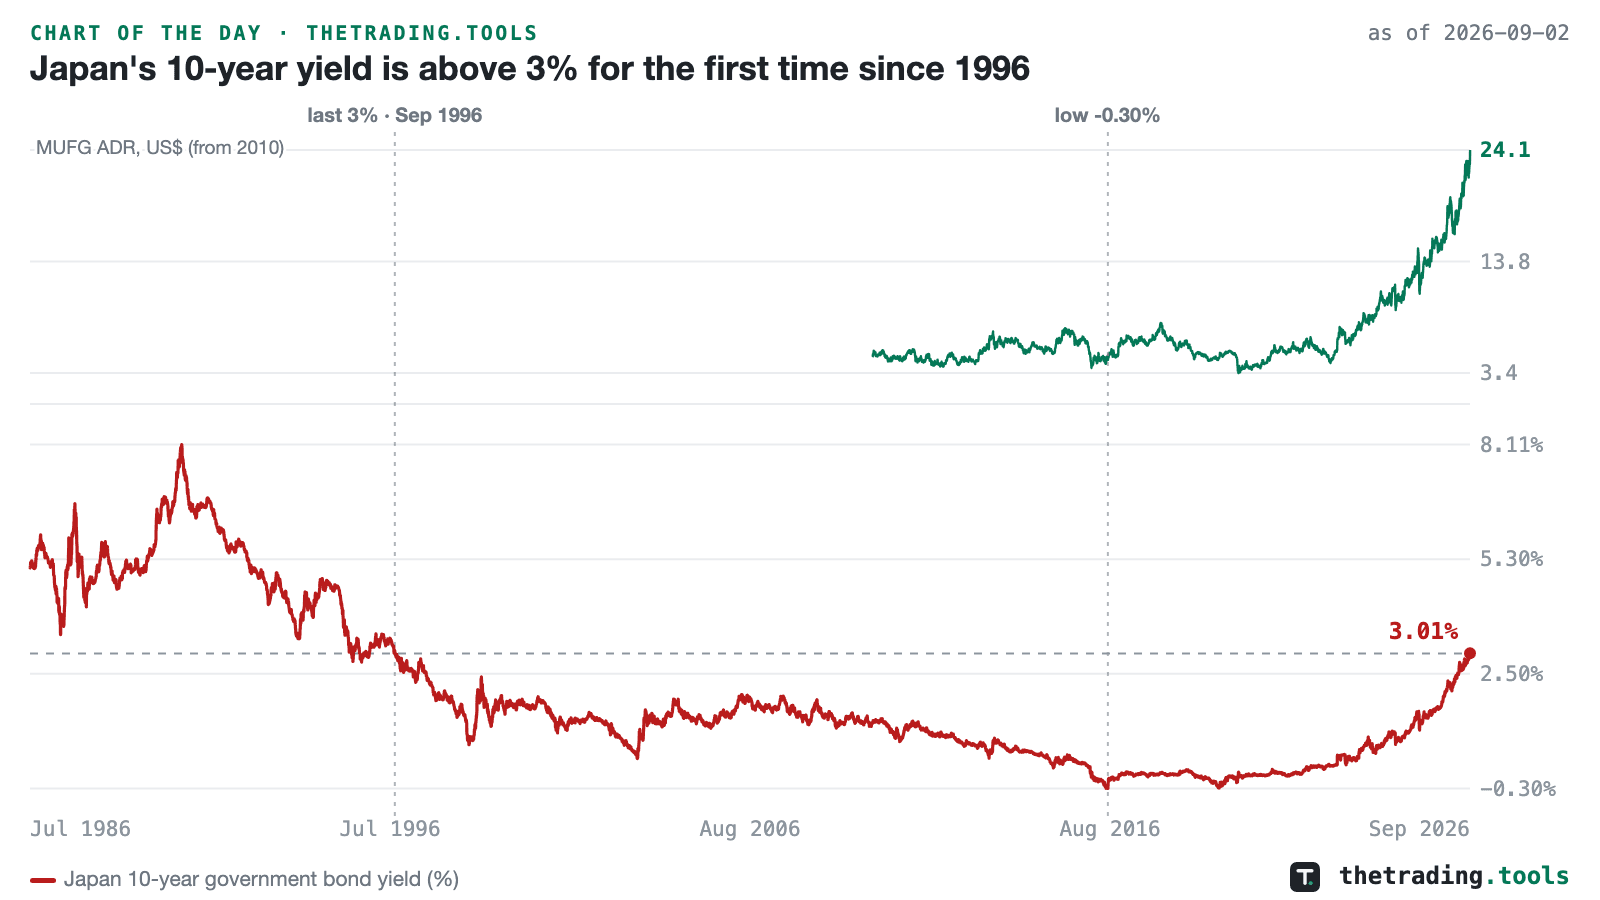
Japan’s 10-year yield is above 3% for the first time since 1996
Japan’s 10-year government bond yield closed at 3.006% on September 2, 2026. The last close at or above 3% was September 6, 1996, thirty years ago. In between, the yield spent most of two decades under 2%, and it bottomed at -0.297% on July 27, 2016, when the Bank of Japan held it below zero. The move from that low to today has taken ten years, and the last year has done most of the work: the yield is up 1.39 points from a year earlier.
as of Sep 2, 2026 (yield) and Sep 3, 2026 (ADRs)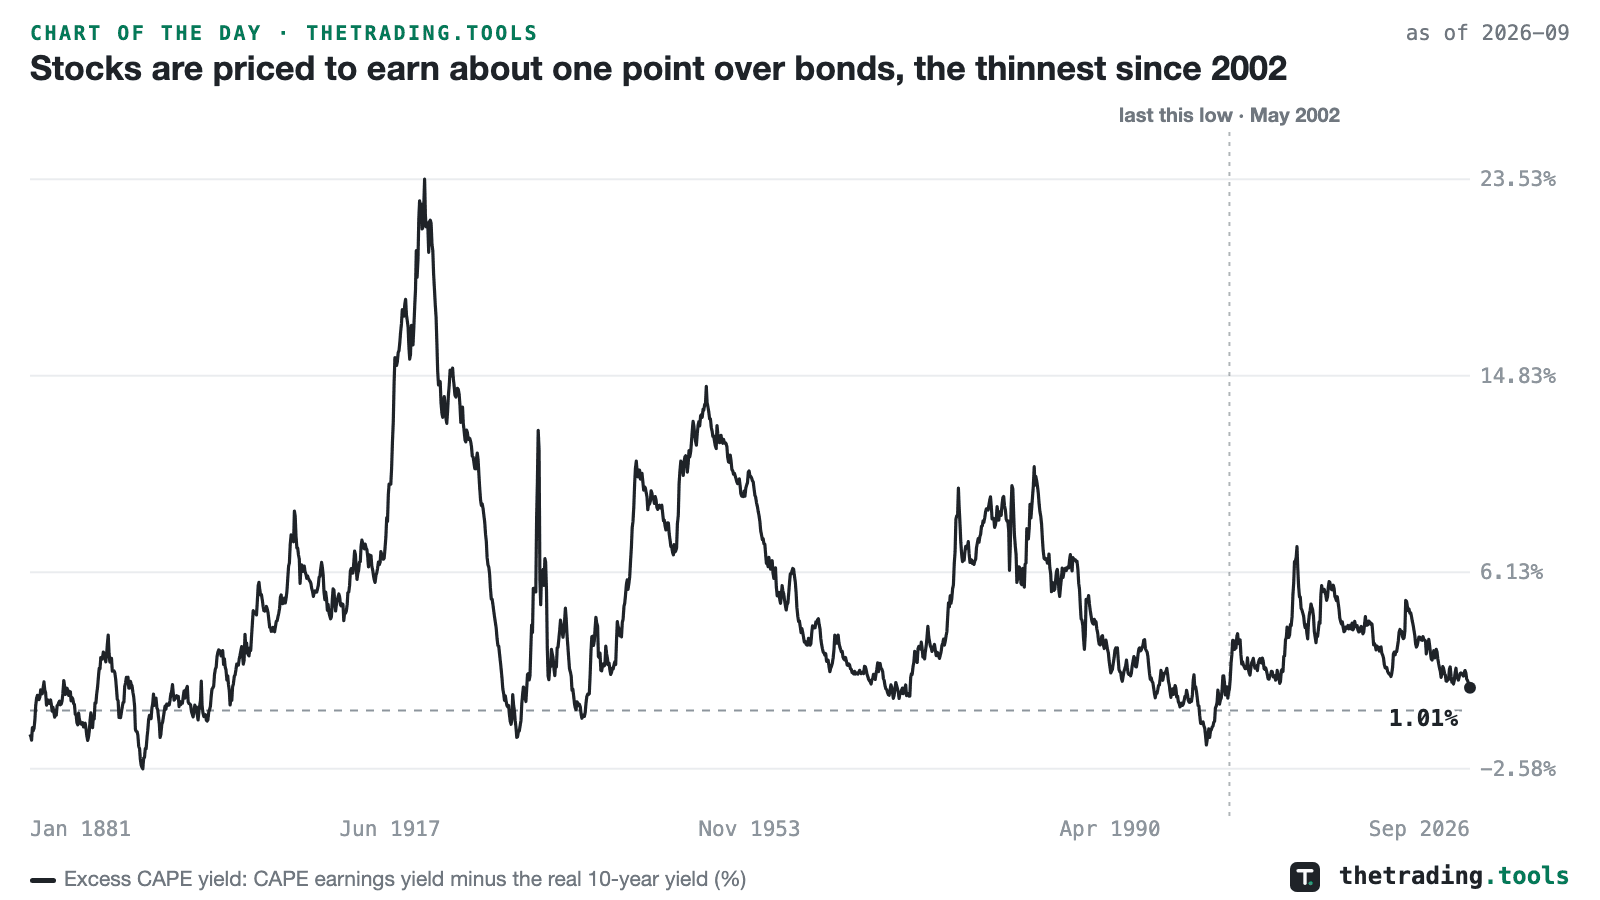
Stocks are priced to earn about one point over bonds, the thinnest since 2002
The excess CAPE yield is the cyclically adjusted earnings yield on the S&P 500 minus the real 10-year Treasury yield. It is Robert Shiller’s answer to the objection that a high CAPE means nothing while bonds pay little. For September 2026 it is 1.01%. The last month it was lower was May 2002, in the aftermath of the dot-com bust. The CAPE itself stands at 40.6, so the earnings yield is about 2.5%, and a real 10-year yield near 1.5% takes most of it.
as of September 2026 (Shiller monthly data)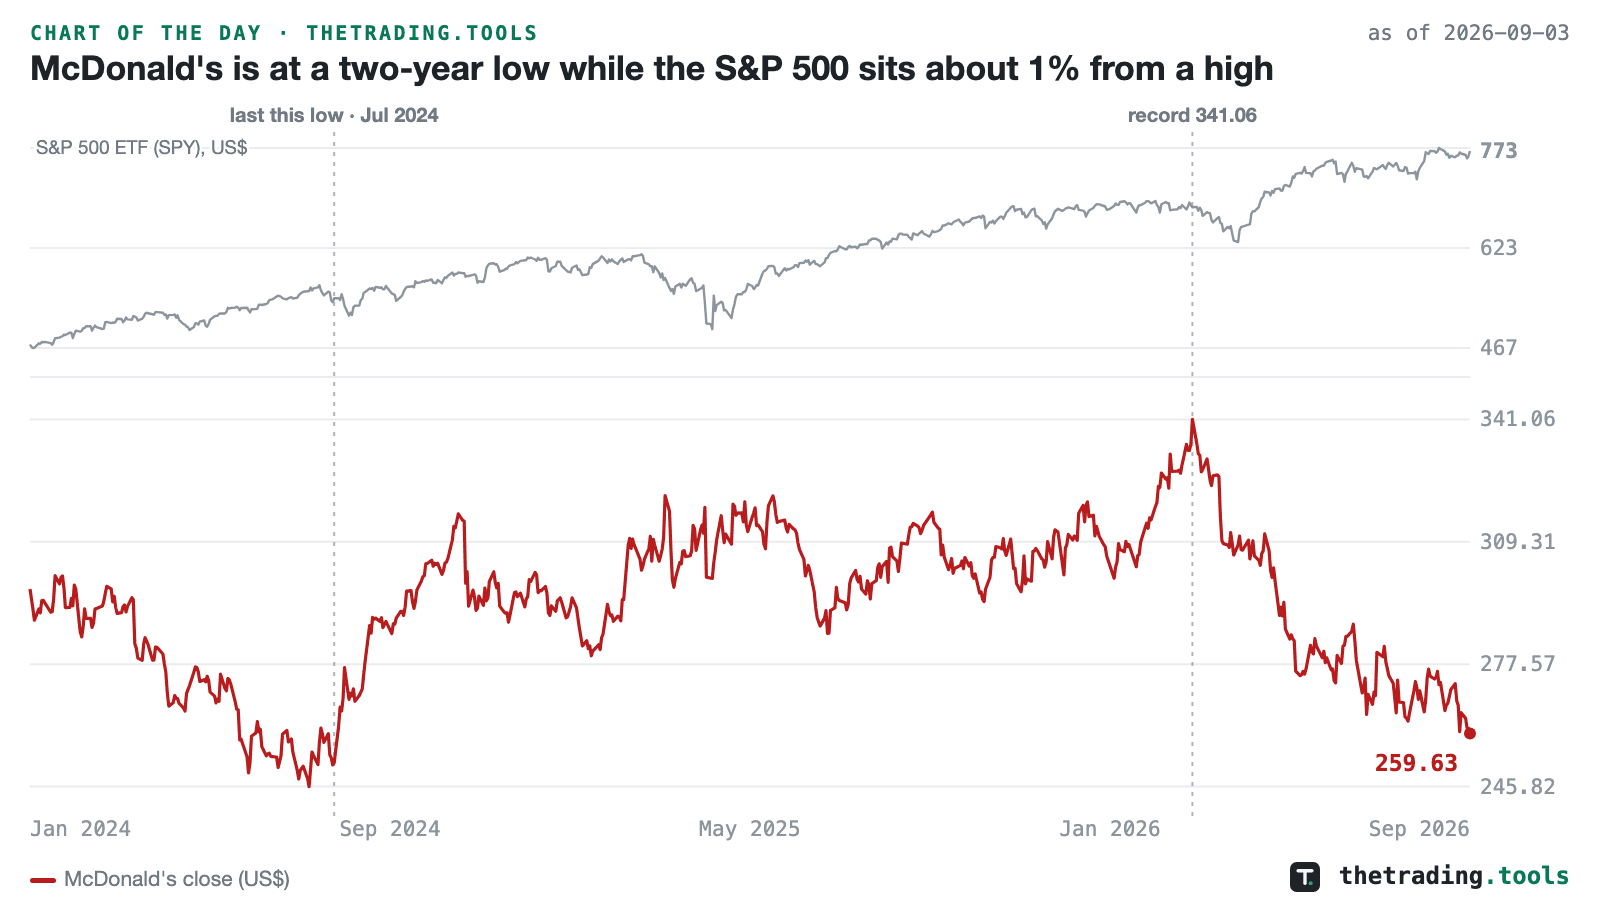
McDonald’s is at a two-year low while the S&P 500 sits about 1% from a high
McDonald’s closed at $259.63 on September 3, 2026. That is its lowest close since July 26, 2024, and it sits 23.9% below the record close of $341.06 set on February 27 of this year. The stock is down 15.1% in 2026. The index it belongs to is not: SPY closed 0.6% from its high the same day and is up 13.4% on the year, so the whole of the decline is the company against its market.
as of Sep 3, 2026Monday, August 31, 2026
3 charts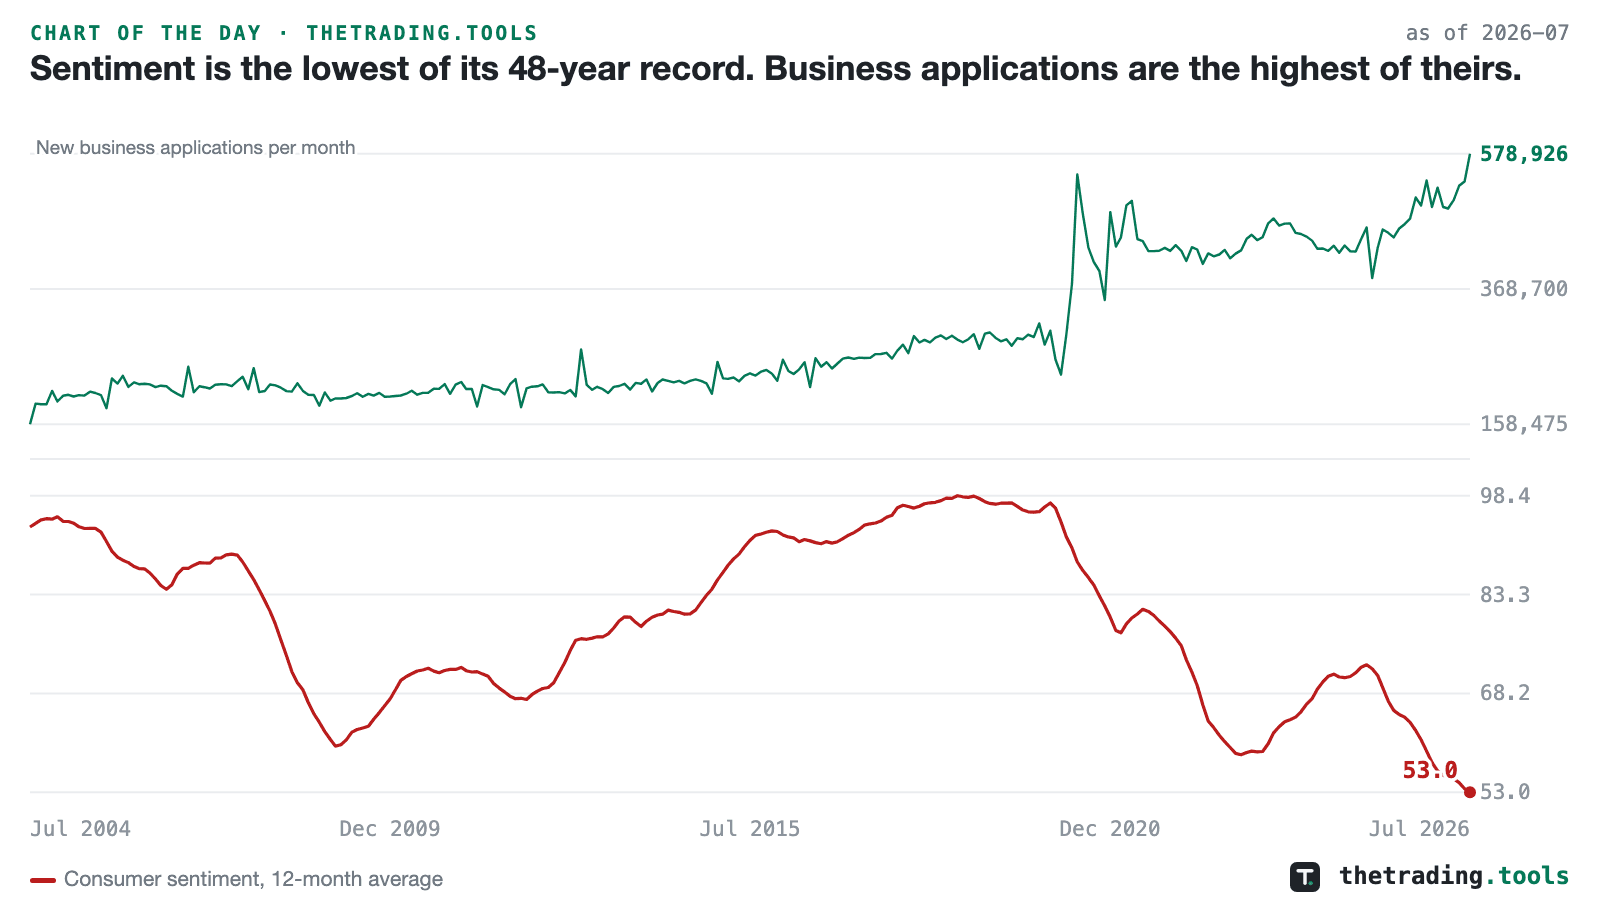
Sentiment is the lowest of its 48-year record. Business applications are the highest of theirs.
Consumer sentiment’s 12-month average fell to 53.0 in July 2026. That is the lowest reading of the average’s entire record, which begins in December 1978 because the University of Michigan survey ran quarterly before then and a 12-month average needs 12 consecutive monthly readings. The eight lowest readings in that 48-year record are the eight most recent months. The comparison worth having is with the prior troughs: 61.0 in 1980, 60.1 in 2008 and 59.0 in 2022. Today sits below all three.
as of July 2026 reference month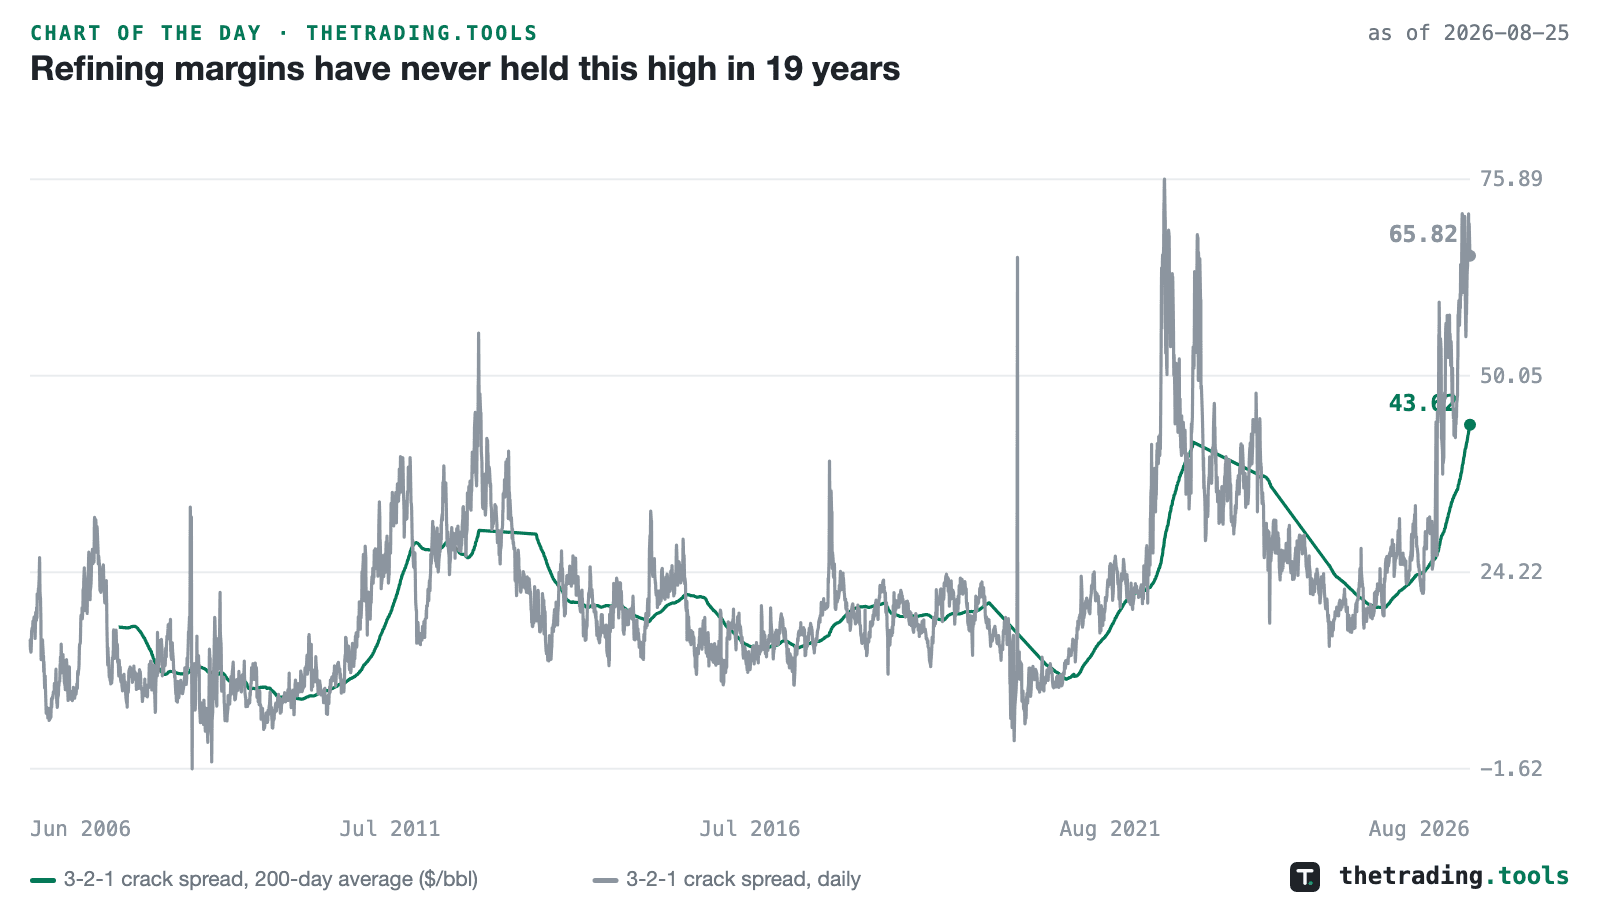
Refining margins have never held this high in 19 years
The 3-2-1 crack spread is what a refiner earns turning three barrels of crude into two of gasoline and one of distillate. Its 200-day average reached $43.62 on August 25, 2026, the highest of the 3,934 sessions in that average’s record back to September 2007. The daily spread finished at $65.82. The distinction matters on this chart: the daily spread was higher during 2022, touching $75.89 in May of that year, so the record here belongs to the sustained level rather than to the peak.
as of Aug 25, 2026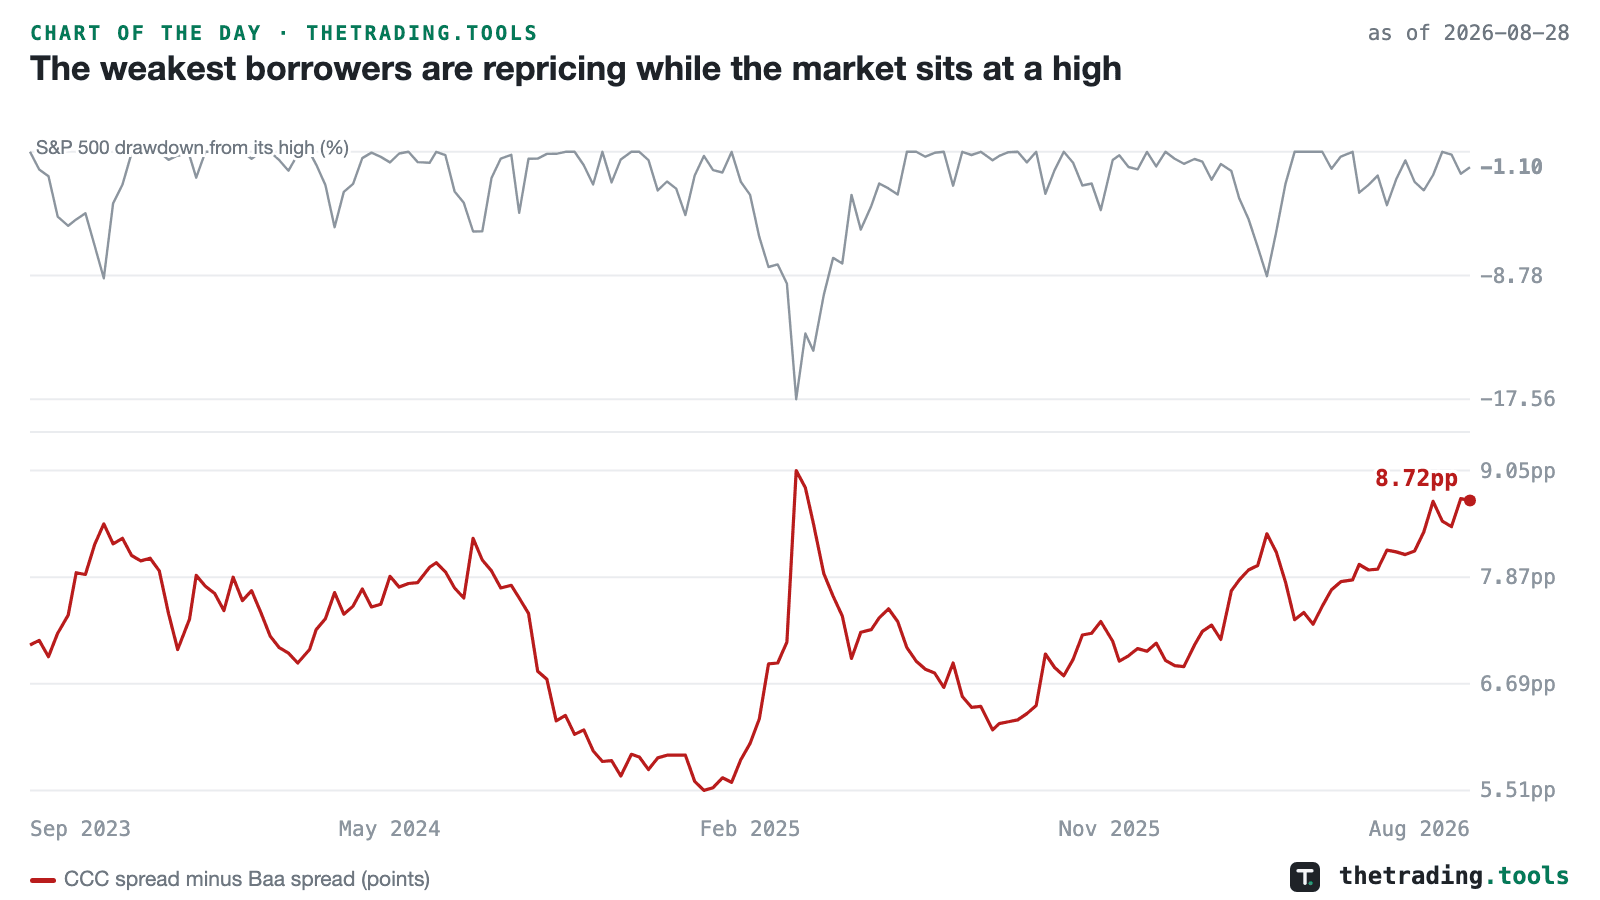
The weakest borrowers are repricing while the market sits at a high
Credit is not moving as one thing. The spread on CCC-rated debt sits 8.72 points above the Baa spread as of August 28, 2026, close to the widest reading of 9.05 in a record that FRED serves back to September 2023. Baa itself is at 1.54%, which is tight by the standards of the modern window. The safest tier of corporate credit and the weakest are being priced further apart than at almost any point in the available history.
as of Aug 28, 2026Thursday, August 27, 2026
3 charts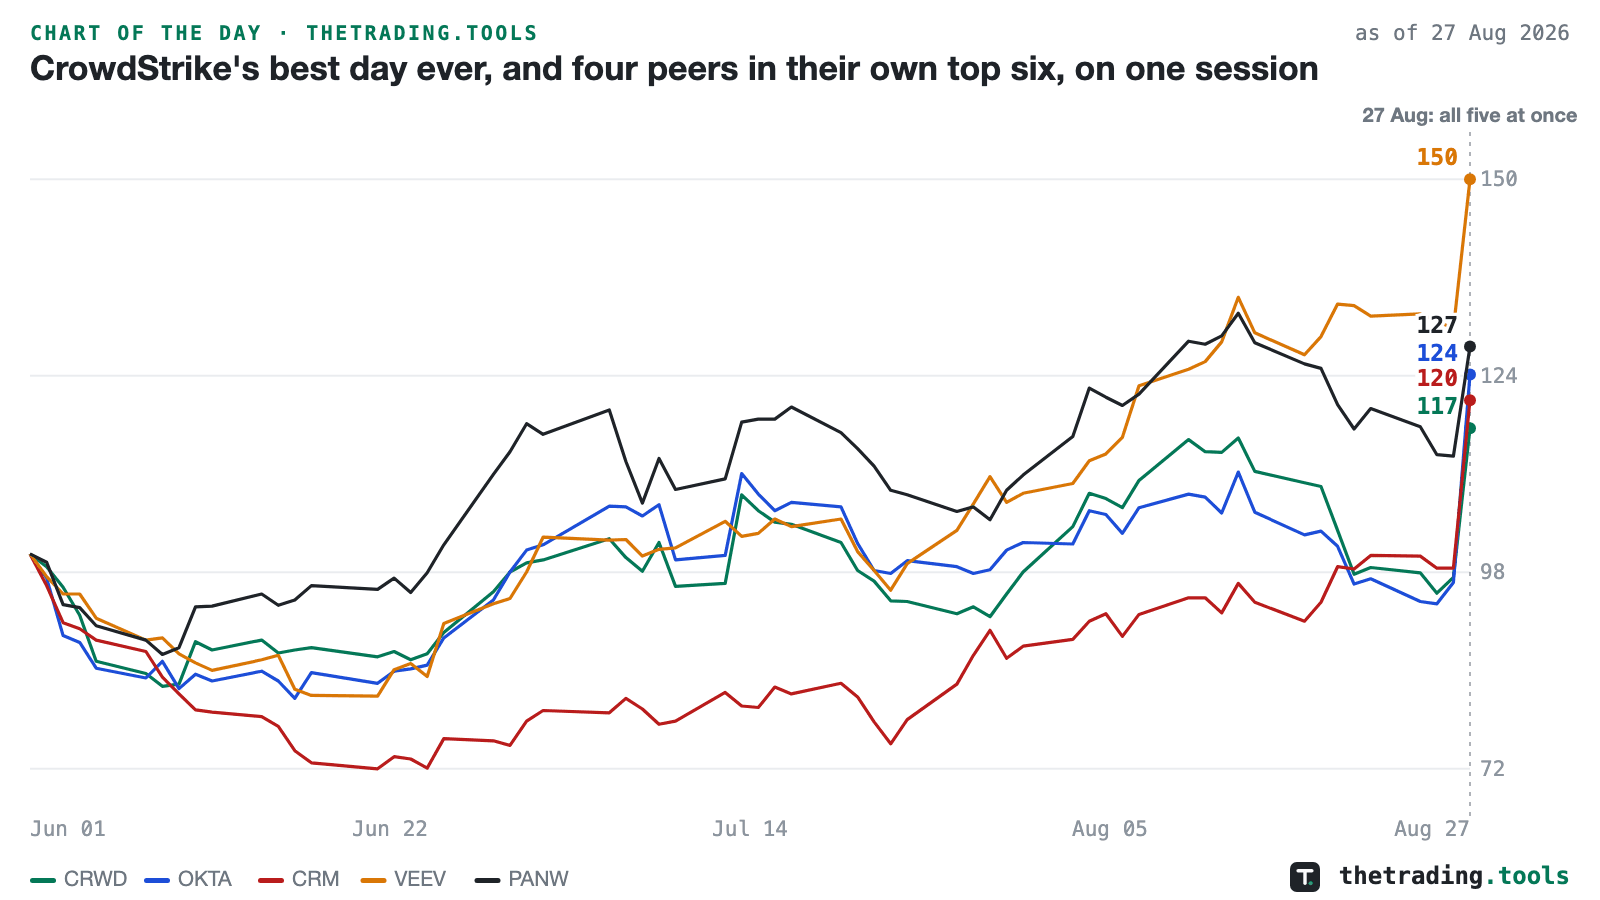
CrowdStrike’s best day ever, and four peers in their own top six, on one session
Enterprise software repriced together on August 27, 2026, and the size of each move matters less than where it sits in that company’s own record. CrowdStrike rose 20.3%, the largest single day in its entire listed life of 1,812 sessions since its June 2019 debut. Okta rose 28.6%, its second-best of 2,359 sessions since listing in April 2017. Veeva rose 15.3%, fourth of 3,234 since October 2013. Palo Alto Networks rose 12.8%, sixth of 3,545 since July 2012. Salesforce rose 22.6%, its second-best of the 4,188 sessions our record holds — that record starts at the end of 2009 and Salesforce listed in 2004, so this is its best day since 2009, and its earlier listed years sit outside our record.
as of Aug 27, 2026 close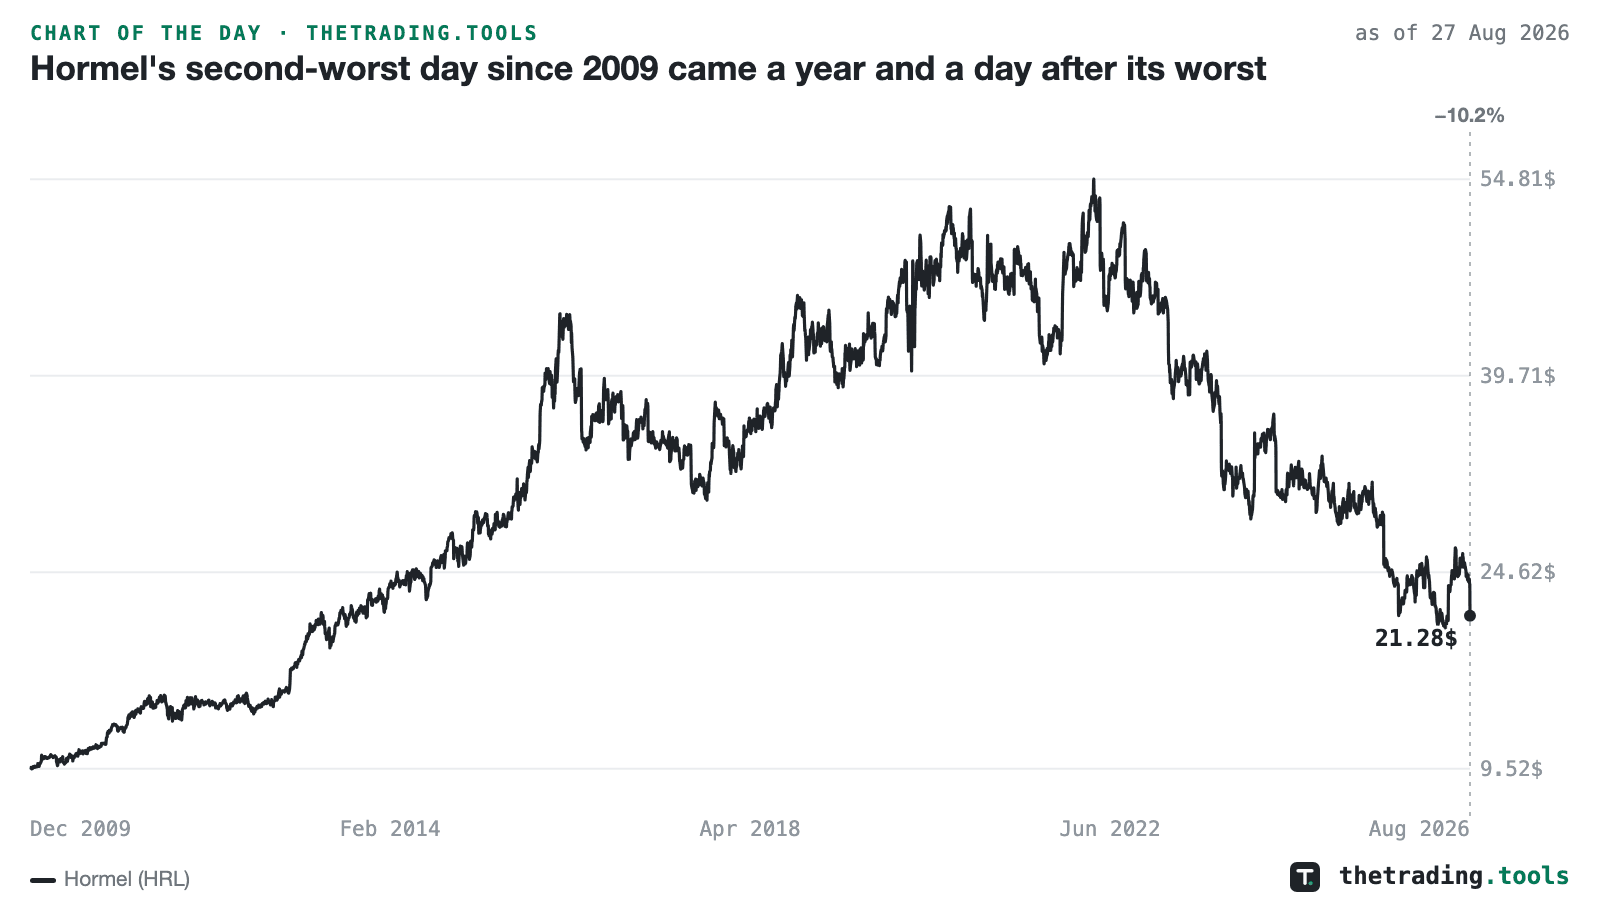
Hormel’s second-worst day since 2009 came a year and a day after its worst
Hormel closed at $21.28 on August 27, 2026, down 10.17%. Measured against the standard deviation of its own trailing year of daily returns, that is a 5.3-sigma session. Our record holds 4,188 trading days back to the end of 2009, and only one of them was worse: August 28, 2025, when the stock fell 13.09%. The two worst sessions in seventeen years landed a year and a day apart, both in the last week of August. Third on the list is October 12, 2023 at −9.83%.
as of Aug 27, 2026 close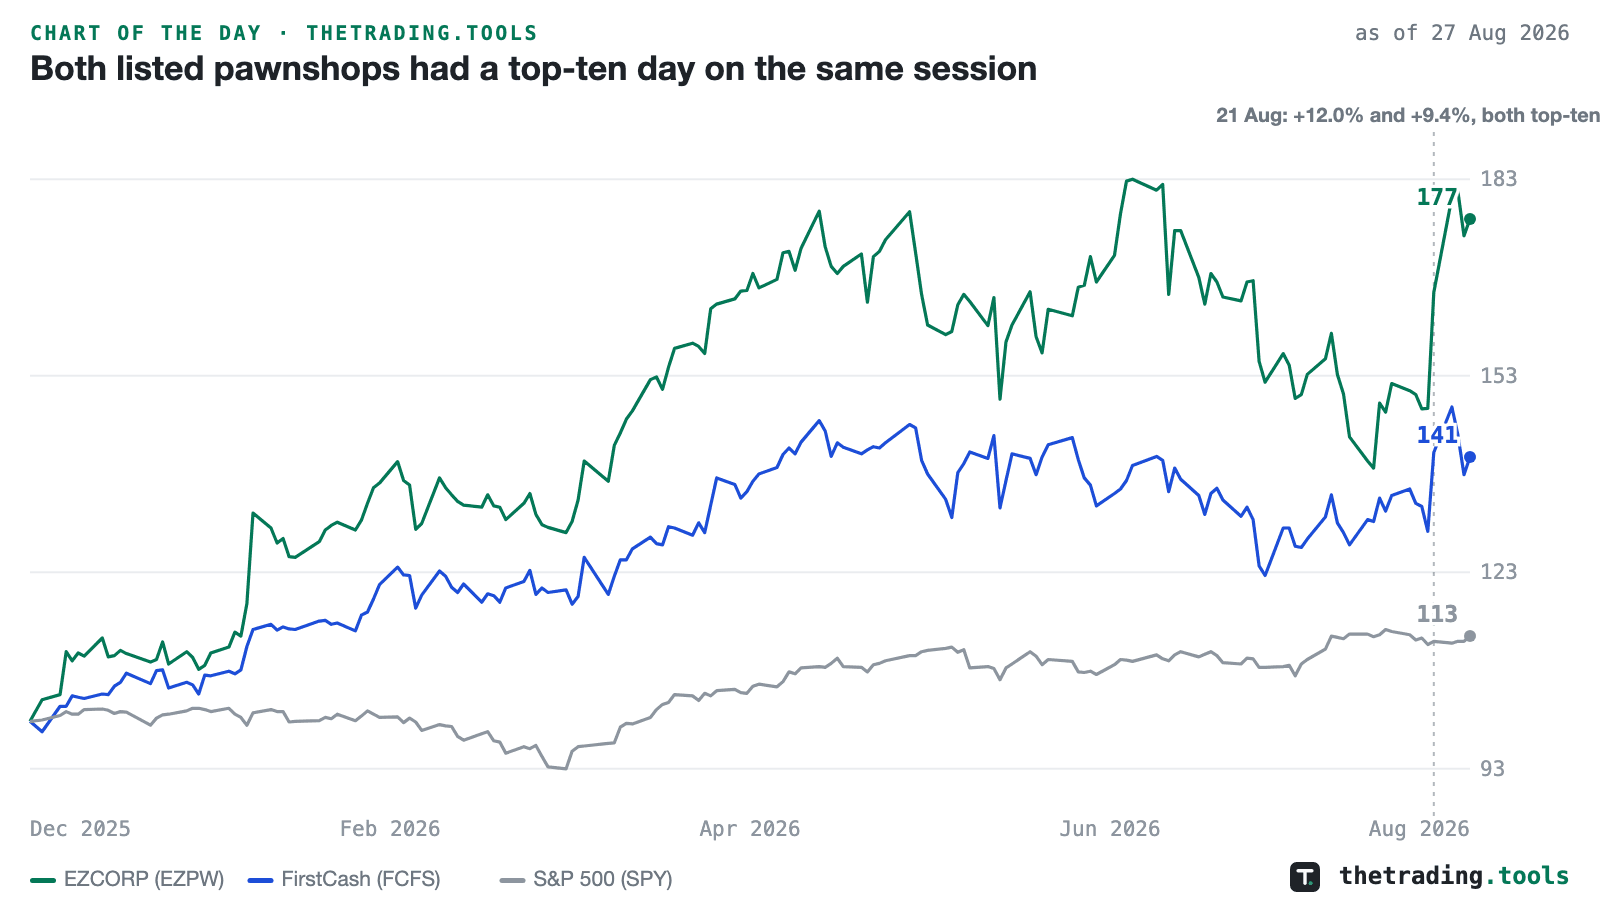
Both listed pawnshops had a top-ten day on the same session
On August 21, 2026 the two listed US pawn lenders had one of their best days on the same session. EZCORP rose 12.03%, the ninth-largest daily gain in its 4,188-session record since the end of 2009. FirstCash rose 9.41%, the eighth-largest in its own record of the same length. Neither ranking would be remarkable alone; two independent companies each reaching their own top ten on one session is what makes it worth a chart.
as of Aug 27, 2026 closeThursday, August 20, 2026
3 charts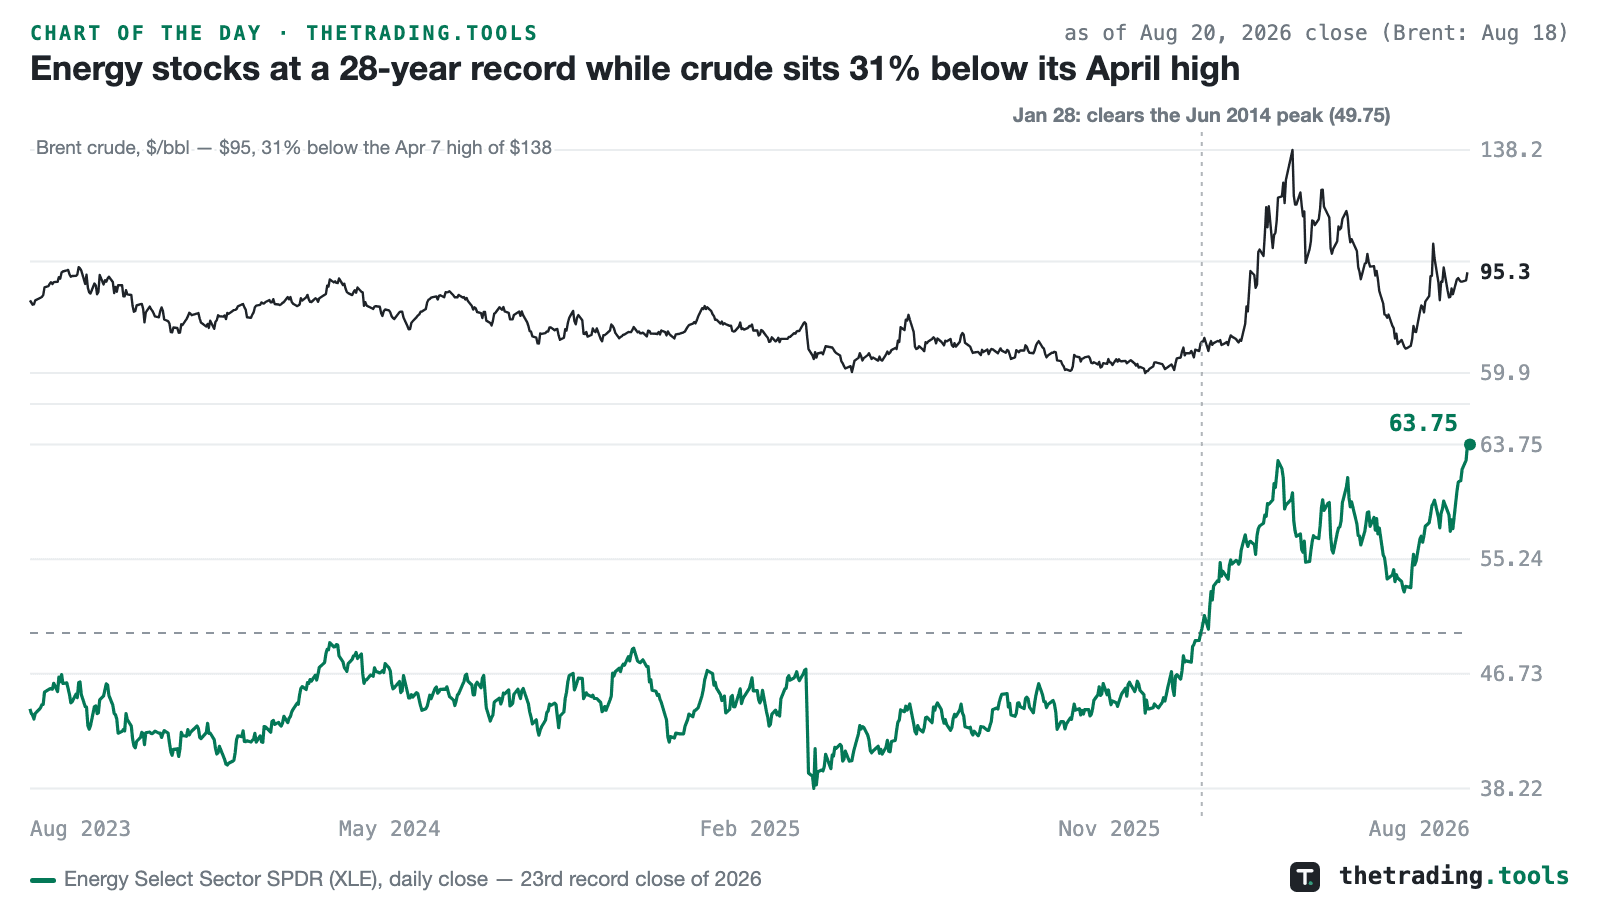
Energy stocks at a 28-year record while crude sits 31% below its April high
The Energy Select Sector SPDR (XLE) closed at 63.75 on August 20, 2026 — its third record close in four sessions (62.58 on the 17th, 63.68 on the 18th) and its 23rd record close of the year. It is up 42.6% year to date and first cleared its June 2014 peak of 49.75 on January 28. Crude did not carry it there: Brent’s latest print is $95.29 (August 18), up 55% on the year but 31% below its April 7 high of $138.21. Inside the group, Targa Resources closed at an all-time high of 302.25, ConocoPhillips at 134.89 is five cents below its November 2022 record, and Imperial Oil has risen nine sessions in a row.
as of Aug 20, 2026 close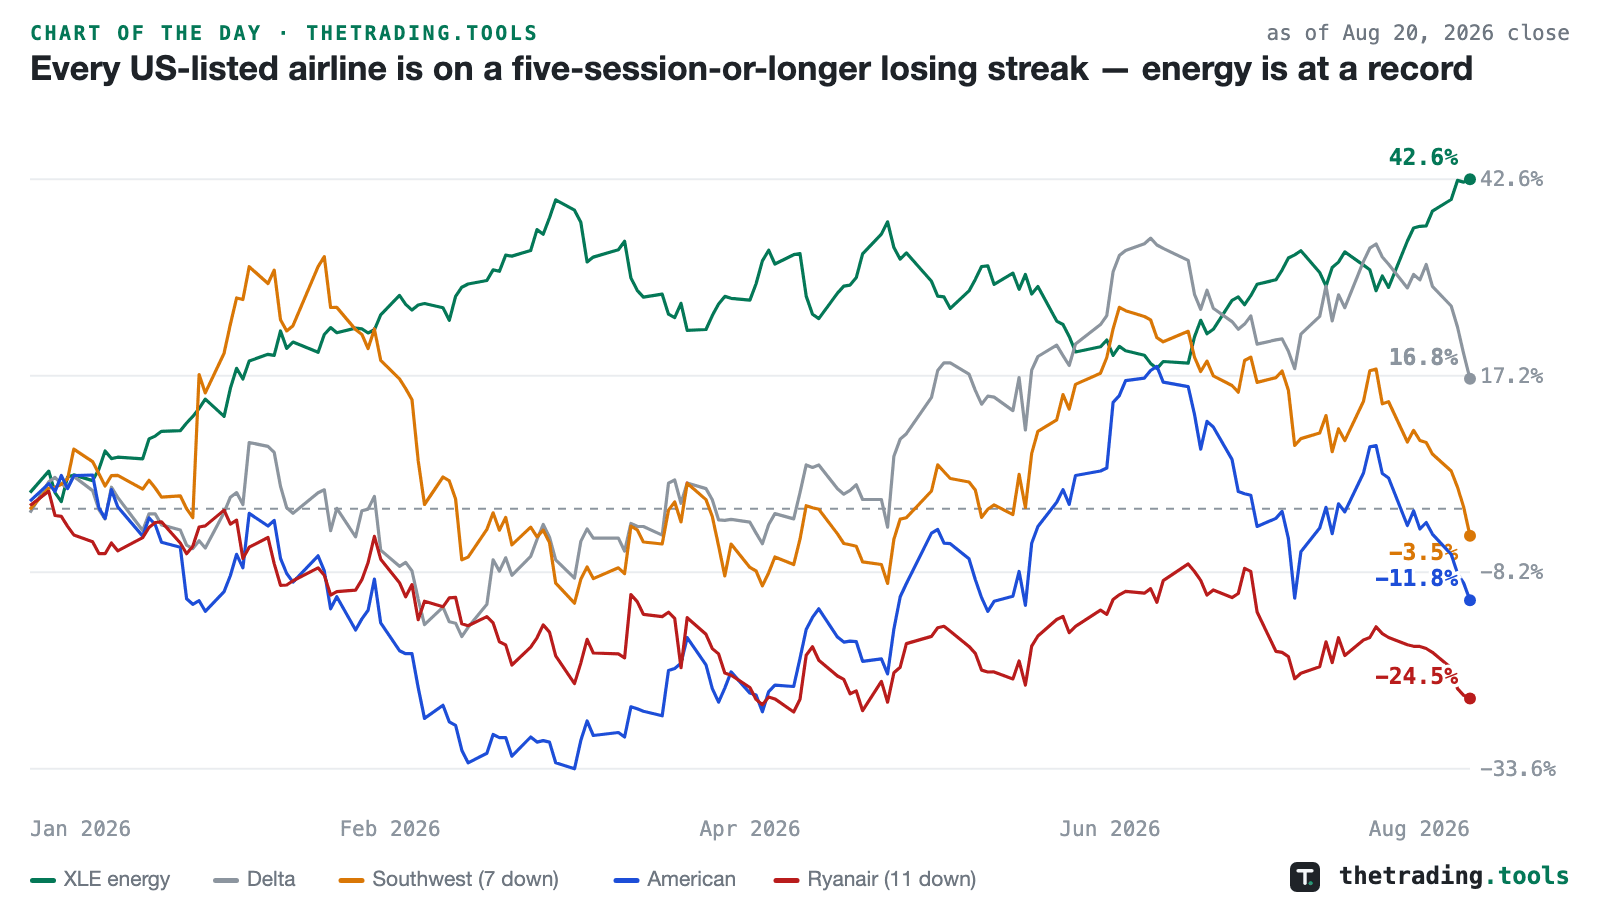
Every US-listed airline is on a five-session-or-longer losing streak — energy is at a record
As of the August 20 close, every US-listed airline in our universe is on a losing streak of at least five sessions: Ryanair 11 straight down closes, Southwest 7, and Delta, United, American, Alaska and JetBlue 5 each. Ryanair’s run is the longest in its record, which begins in 2009; the stock has lost 10.9% over it and is down 24.5% for the year. The group’s 2026: Ryanair −24.5%, Alaska −20.1%, American −11.8%, Southwest −3.5%, United −0.1%, JetBlue +4.2%, Delta +16.8% — against the S&P 500 at +11.8% and XLE at +42.6%.
as of Aug 20, 2026 close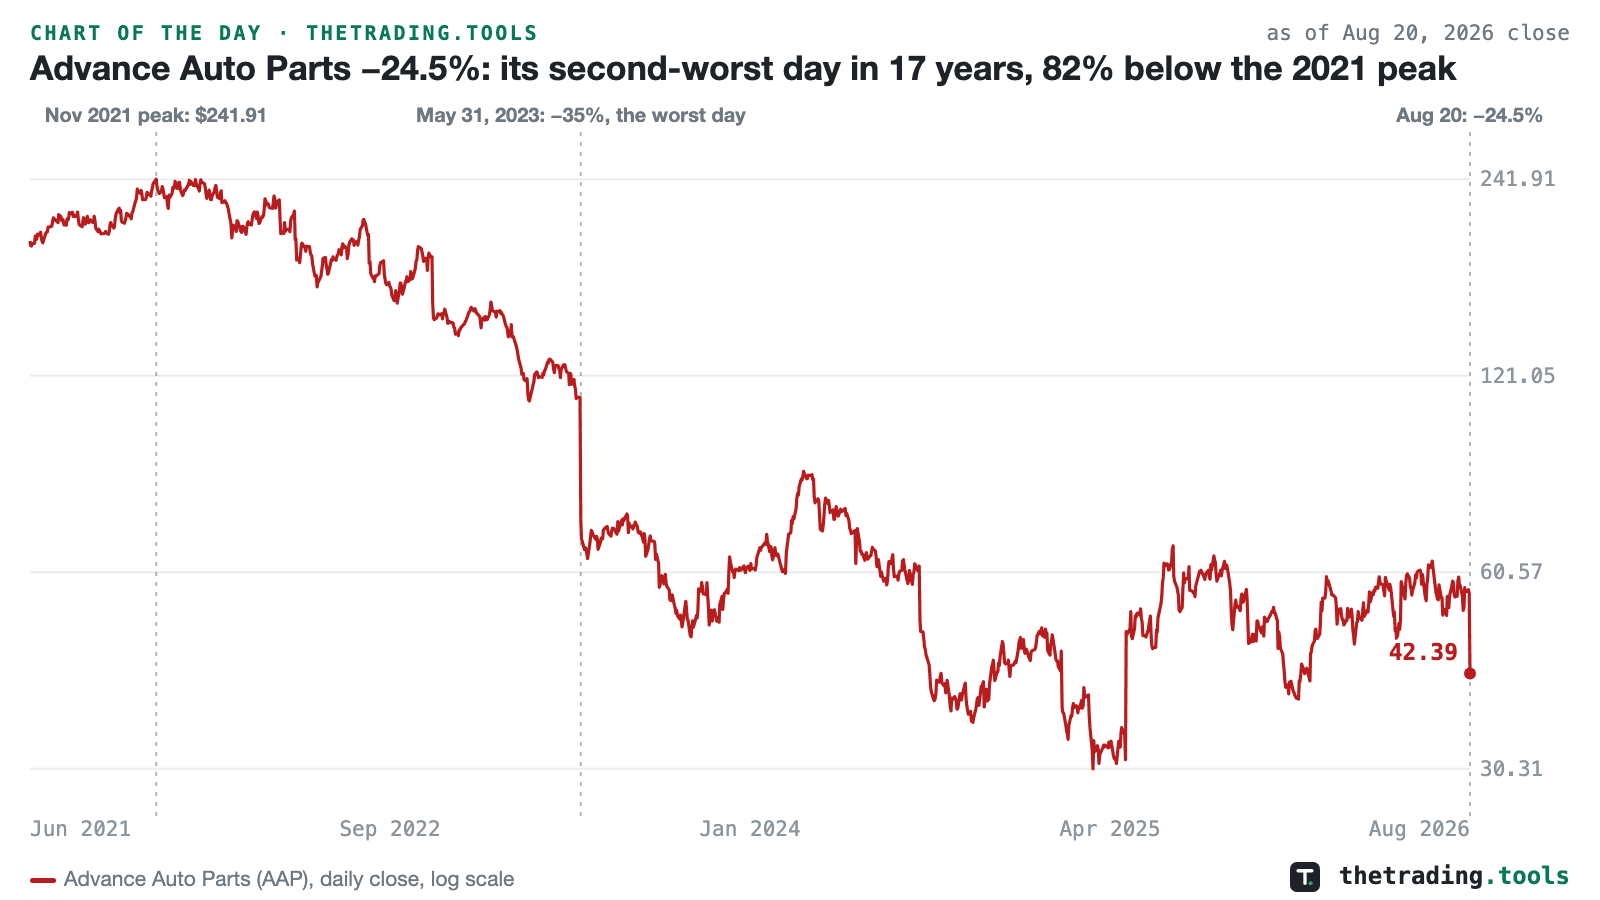
Advance Auto Parts −24.5%: its second-worst day in 17 years, 82% below the 2021 peak
Advance Auto Parts closed at $42.39 on August 20, 2026, down 24.5% on 17.2 million shares — 8.3 times its trailing 63-session average. In our record, which begins at the end of 2009, only May 31, 2023 (−35.0%) was a worse day. The stock is 82% below its November 15, 2021 peak of $241.91. The quarter behind the move: revenue of $2.0 billion, flat year over year and below the $2.04 billion consensus; full-year guidance of about $8.53 billion, under the $8.58 billion the Street carried; and management’s line that DIY demand is constrained by “tighter household budgets.”
as of Aug 20, 2026 closeWednesday, August 19, 2026
3 charts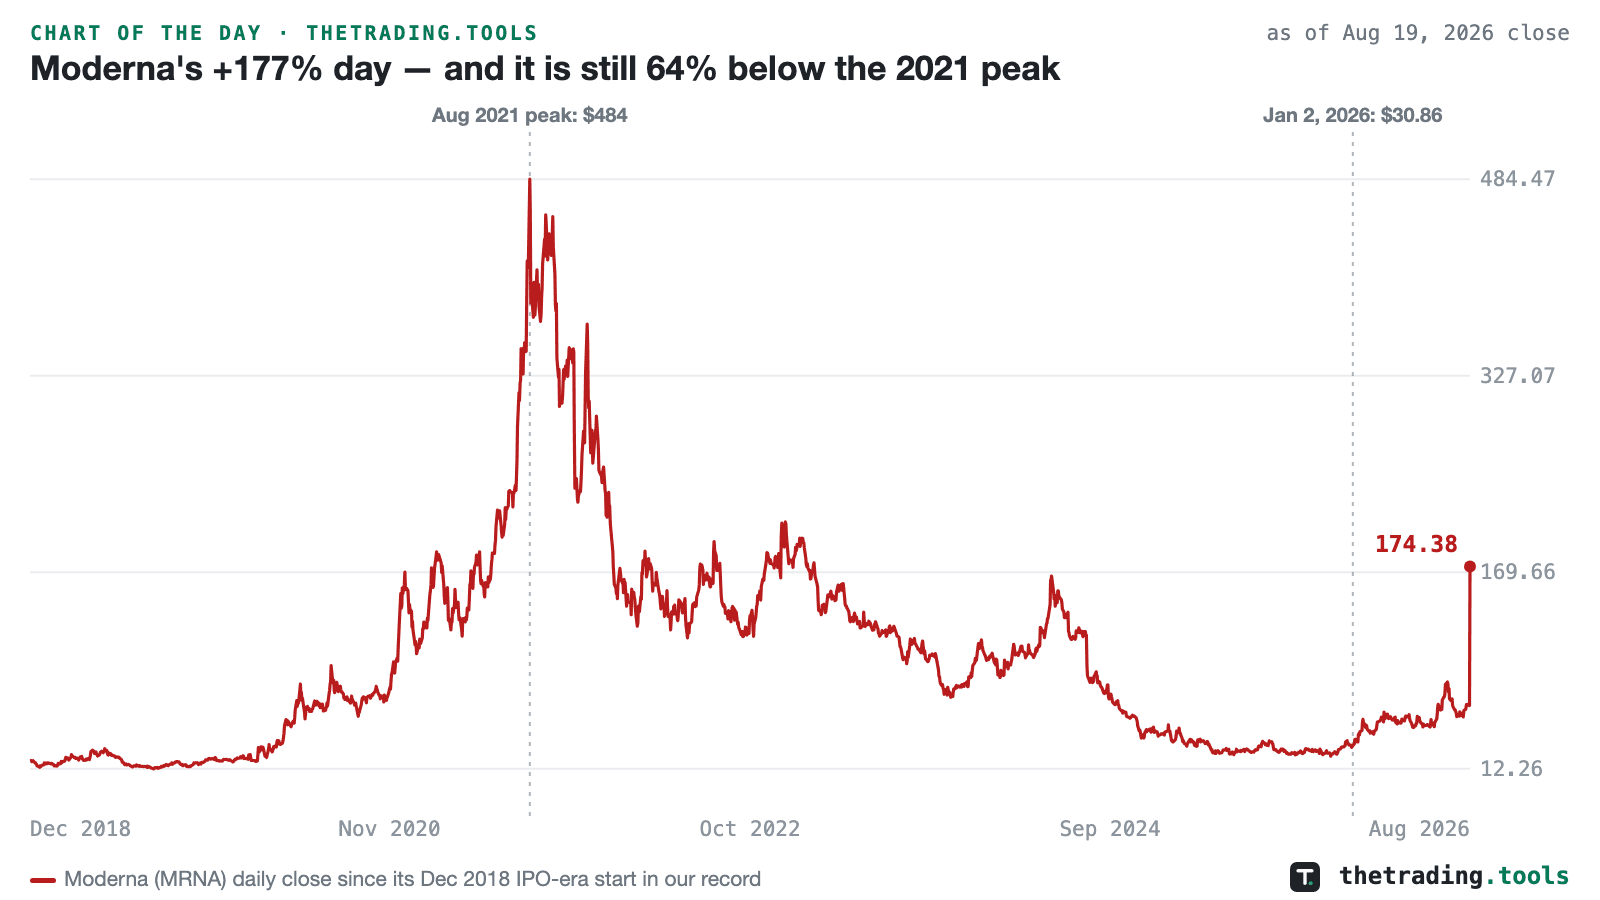
Moderna's +177% day — and it is still 64% below the 2021 peak
Moderna closed at $174.38 on August 19, up 177.0% from the prior close of $62.96, on 192 million shares — 29 times its trailing three-month average volume. The move followed the announcement that the Moderna–Merck personalized mRNA melanoma vaccine met its goals in a late-stage trial with Keytruda, the first successful phase-3 readout for an mRNA cancer vaccine. It is by far the largest one-day gain in the stock’s history; the prior best was +27.8% in February 2020. At the post-move market value, the session added roughly $43 billion.
as of Aug 19, 2026 close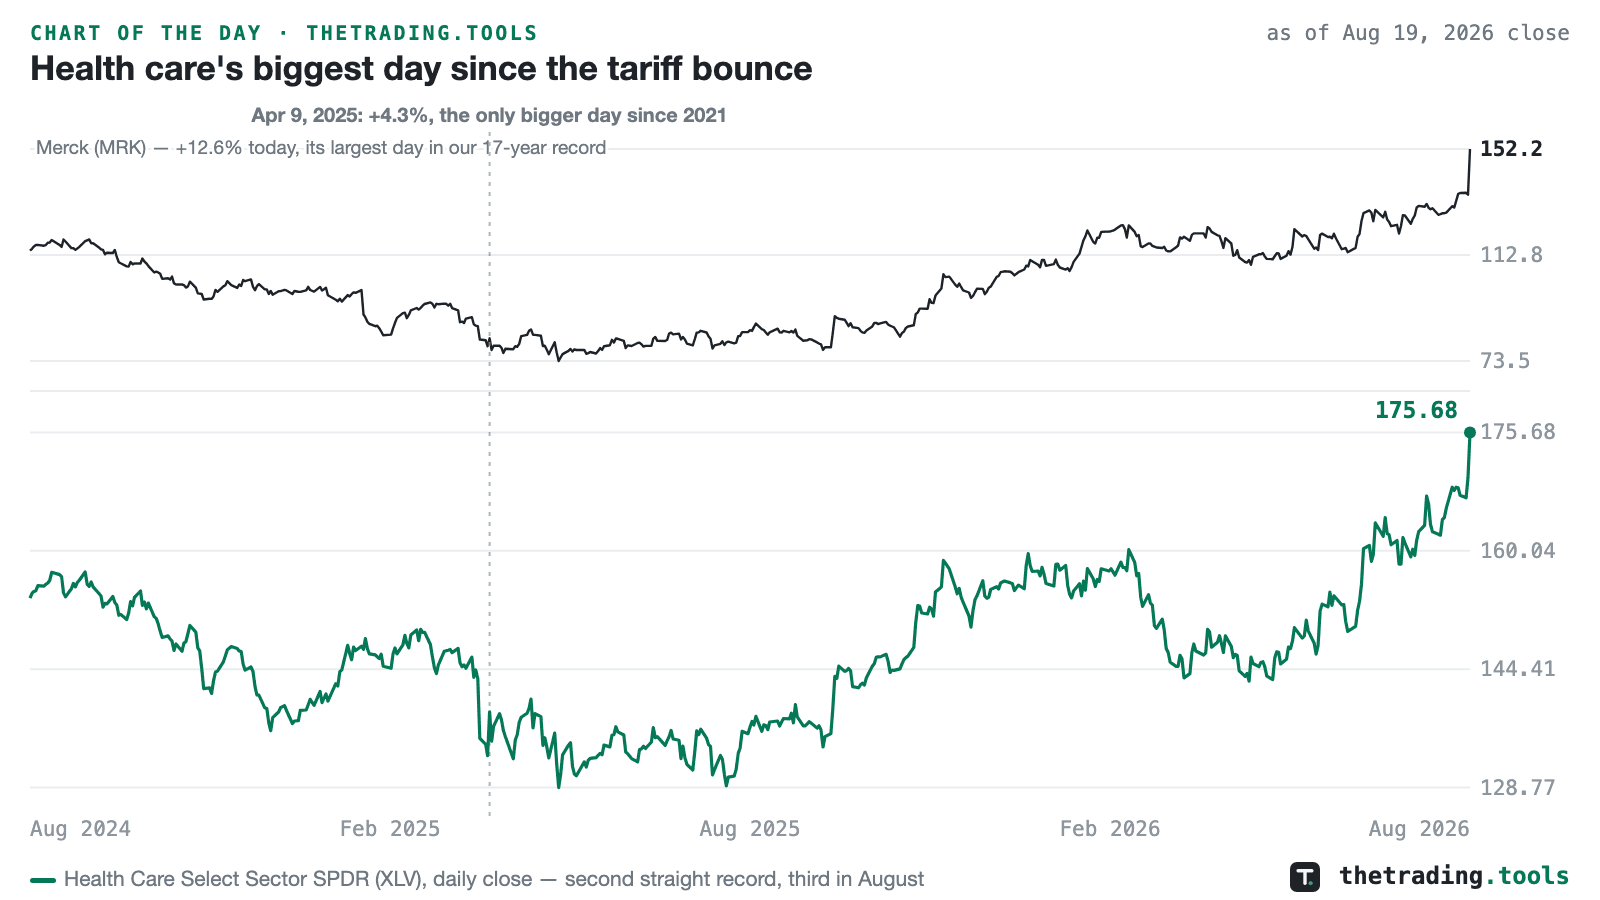
Health care's biggest day since the tariff bounce
The Health Care Select Sector SPDR (XLV) rose 3.5% on August 19 to a record close of 175.68 — its largest one-day gain since April 9, 2025, the tariff-pause bounce, and its second straight record close, the third in August. The driver was one trial readout: the Moderna–Merck personalized mRNA melanoma vaccine met its late-stage goals. Merck gained 12.6%, the biggest single day in our 17-year record for the stock, closing at a fresh 52-week high of $152.20 at a market value near $380 billion; BioNTech rose 22.0% and Moderna 177%.
as of Aug 19, 2026 close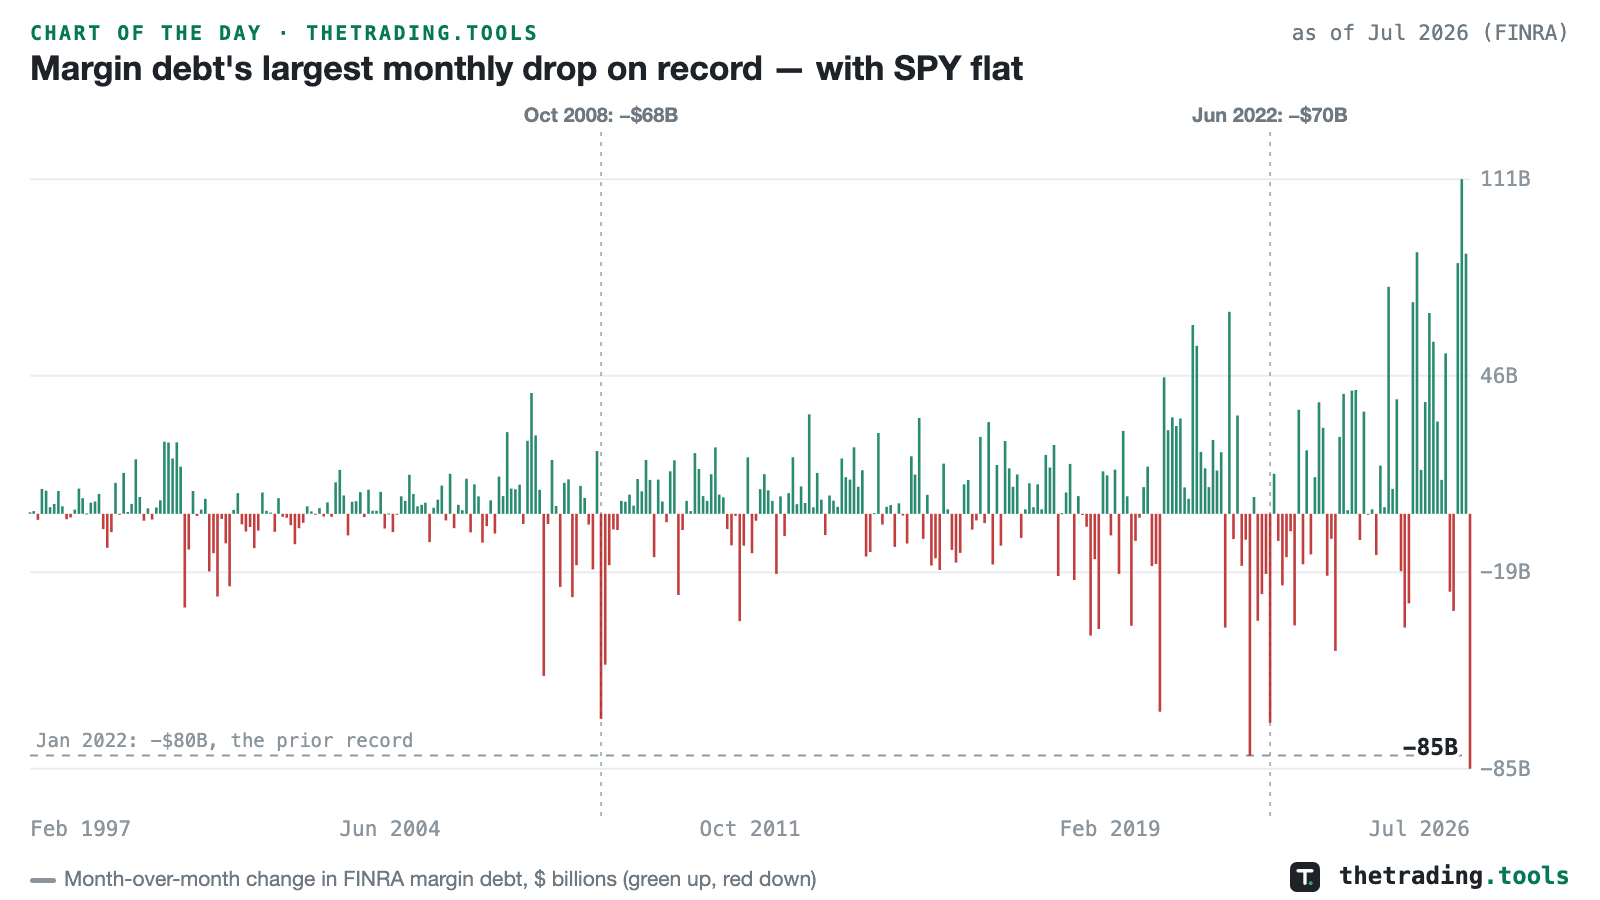
Margin debt's largest monthly drop on record — with SPY flat
FINRA’s July report, published August 17: margin debt fell $84.8 billion in one month, from June’s record $1.502 trillion to $1.417 trillion. In dollar terms that is the largest monthly decline in the record, which begins in 1997 — ahead of January 2022 (−$80.4 billion), June 2022 (−$69.5 billion) and October 2008 (−$68.2 billion). Each of those three came inside a falling market. This one arrived with SPY flat for the month: investors reduced leverage without being forced to.
as of Jul 2026 (FINRA)Tuesday, August 18, 2026
3 charts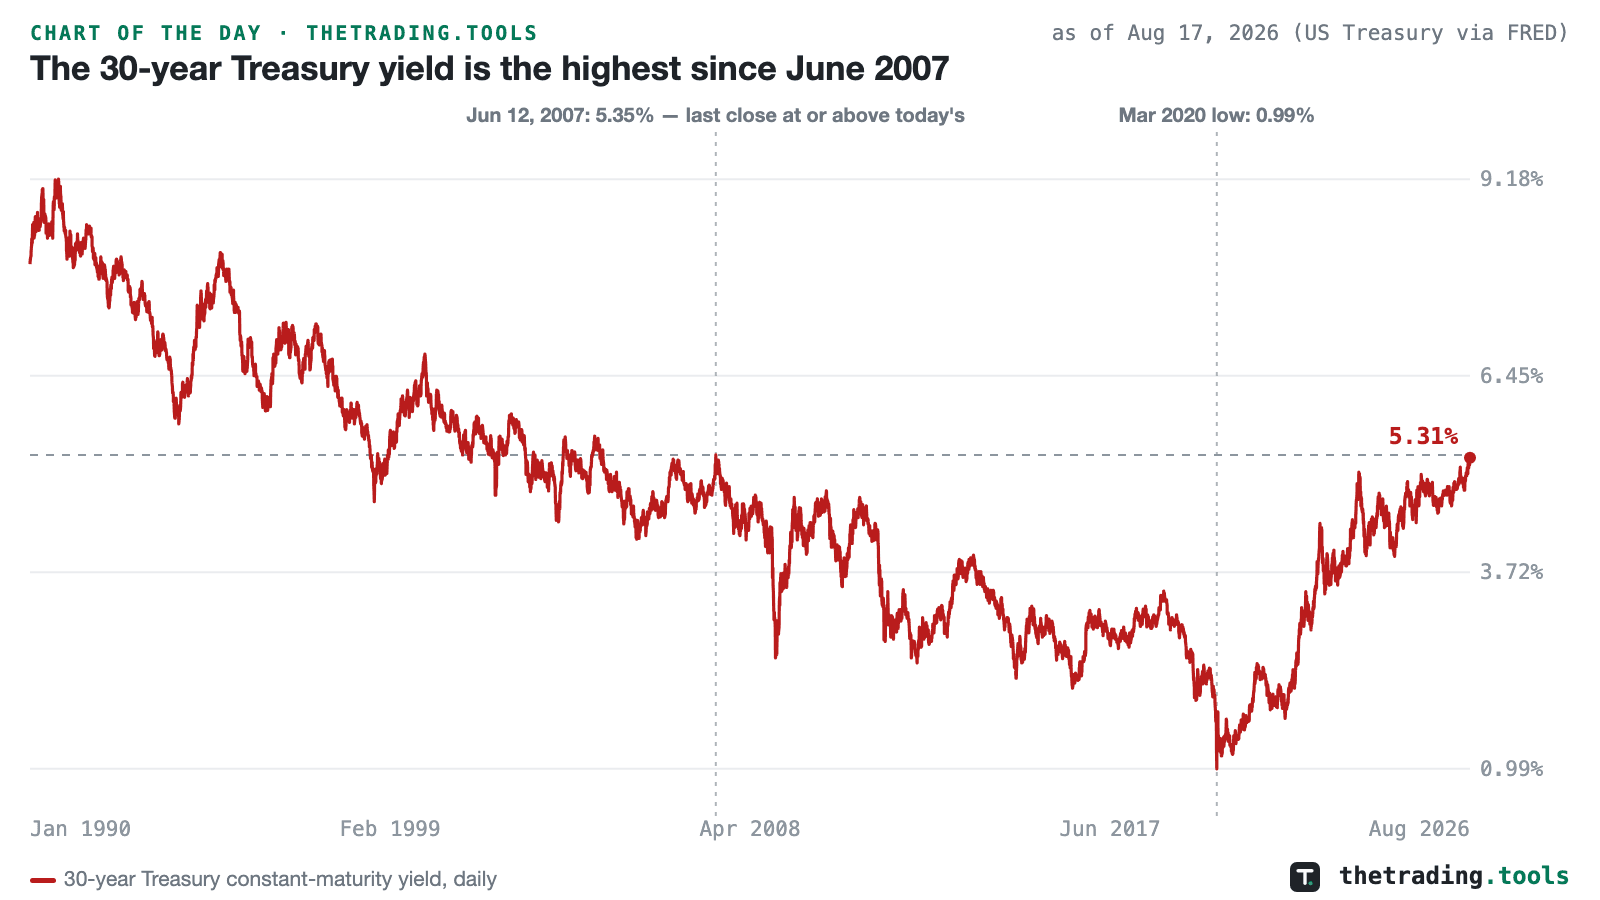
The 30-year Treasury yield is the highest since June 2007
The 30-year Treasury constant-maturity yield closed at 5.31% on August 17, 2026. The last close at or above that level was June 12, 2007, at 5.35%; nothing in the nineteen years between reached it, including the October 2023 peak. The 2-year sits at 4.19% and the 10-year at 4.72%, so the 30-year now yields 112 basis points more than the 2-year: the repricing is concentrated at the long end.
as of Aug 17, 2026 (US Treasury via FRED)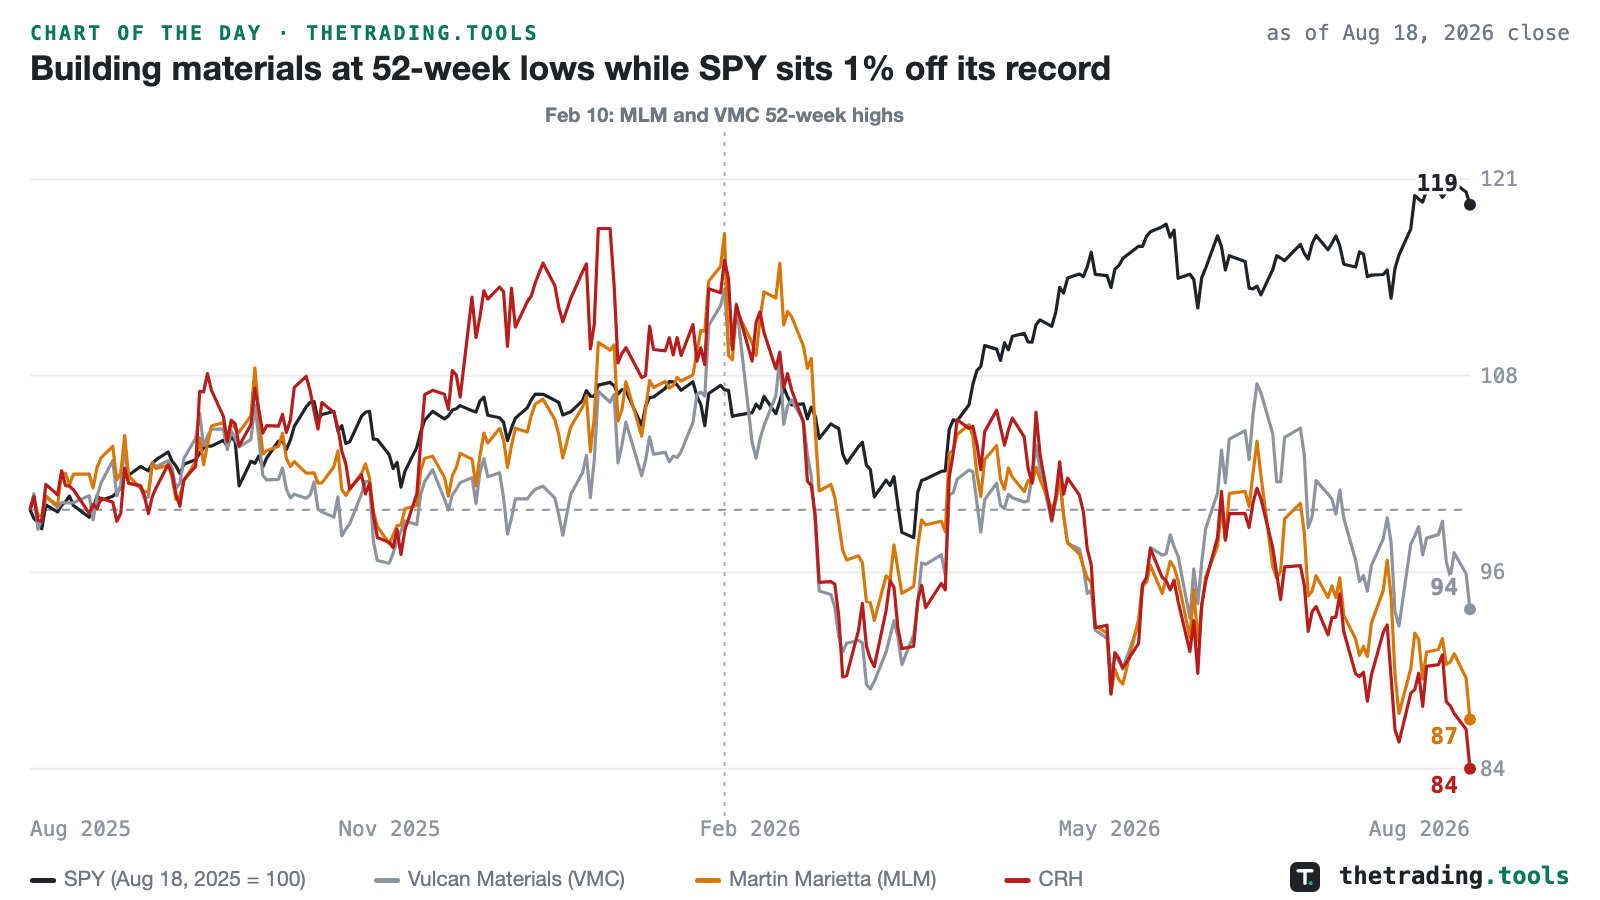
Building materials at 52-week lows while SPY sits 1% off its record
CRH closed at $93.25 and Martin Marietta at $522.81 on August 18, both fresh 52-week lows. CRH is 29% below its January 9 high of $131.38 and Martin Marietta 26% below its February 10 high of $708.11; Vulcan Materials, at $271.65, is 18% below its own February 10 high. Over the past year the three are down 16%, 13% and 6% while SPY is up 19%, and the index sits 1.3% below its August 13 record close.
as of Aug 18, 2026 close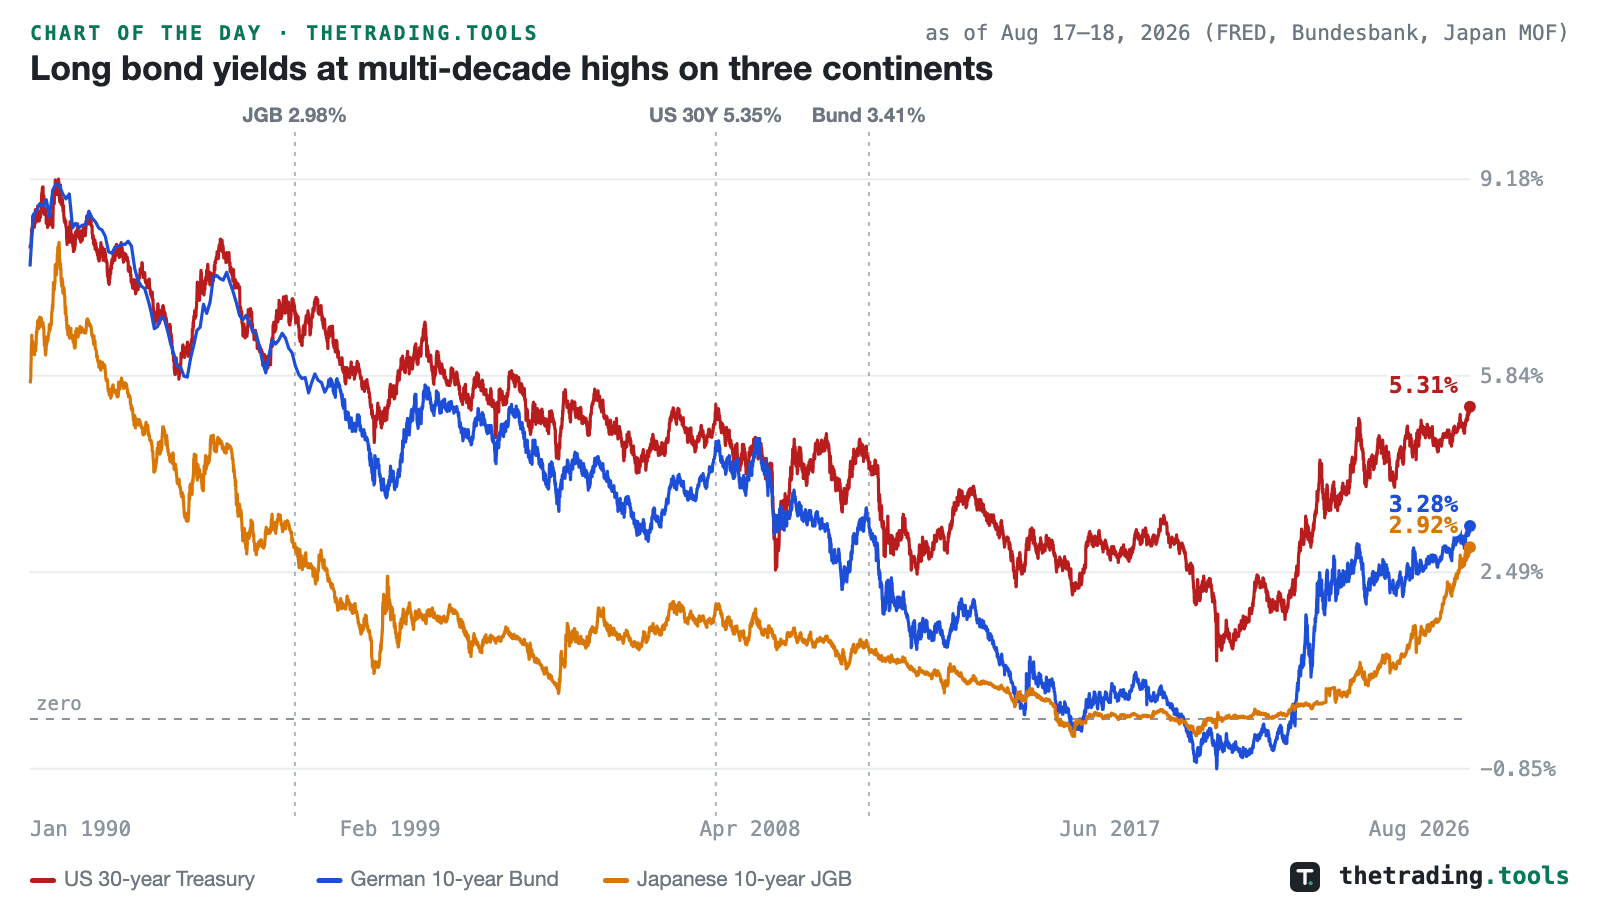
Long bond yields at multi-decade highs on three continents
The US 30-year Treasury yield closed at 5.31% on August 17, its highest since June 12, 2007 (5.35%). The German 10-year Bund yield reached 3.28% on August 18, its highest since May 5, 2011 (3.41%). Japan’s 10-year JGB yield closed at 2.92% on August 17, its highest since September 27, 1996 (2.98%). Three of the world’s largest government bond markets are pricing long-term money at levels last seen fifteen, nineteen and thirty years ago.
as of Aug 17–18, 2026 (FRED, Bundesbank, Japan MOF)Monday, August 17, 2026
6 charts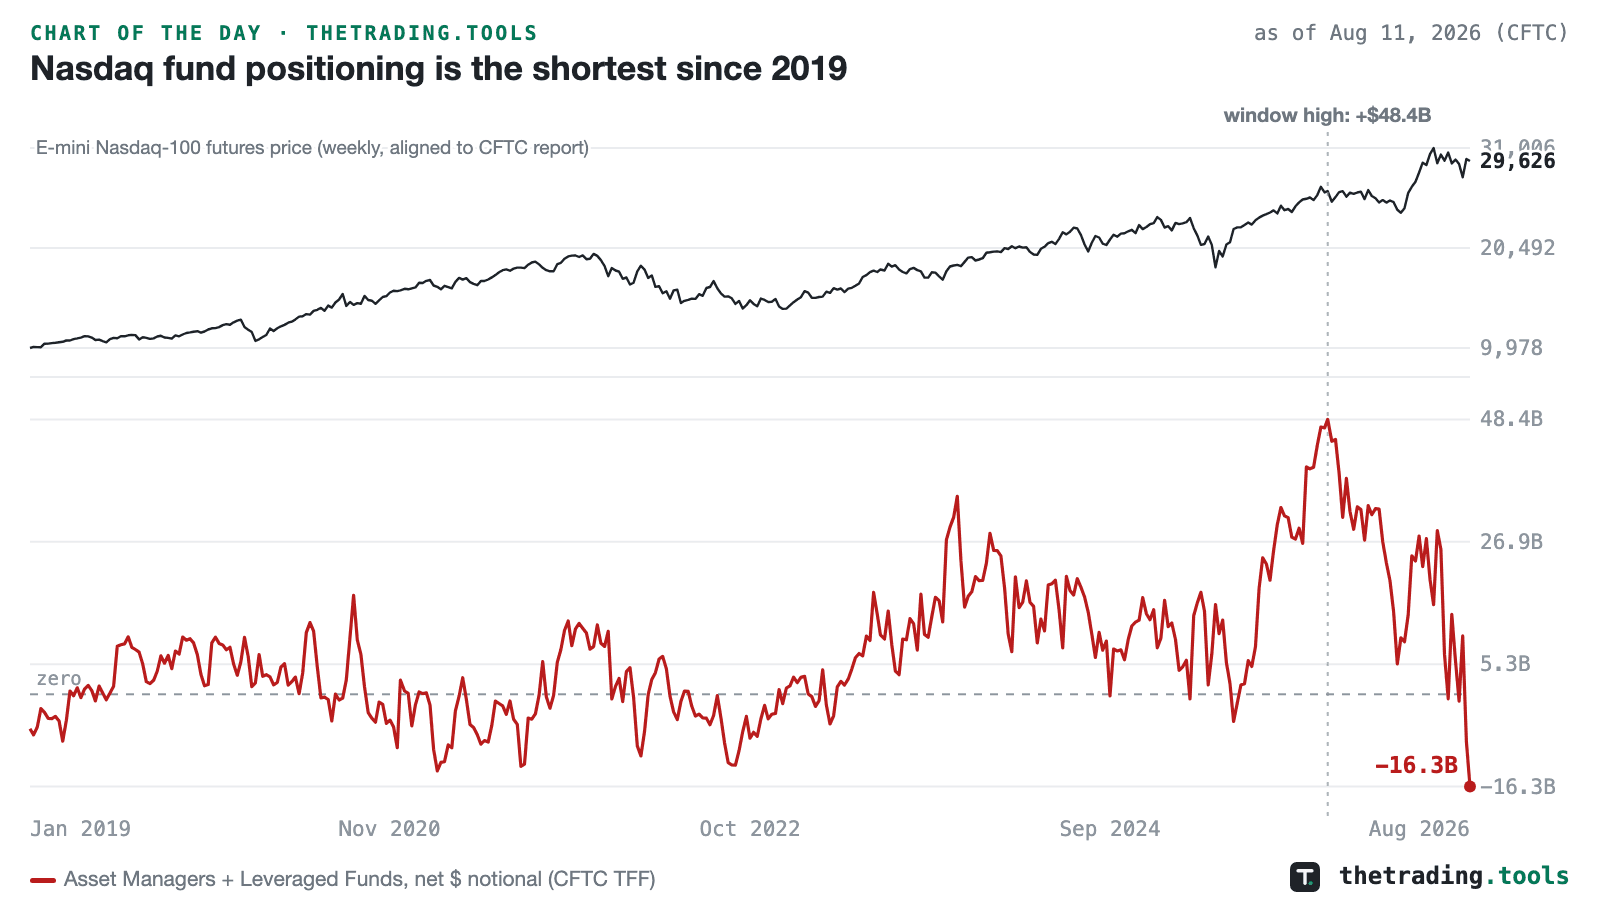
Nasdaq fund positioning is the shortest since 2019
Asset managers and leveraged funds held a combined net short of 27,460 E-mini Nasdaq-100 futures contracts in the CFTC’s August 11 report. At the aligned NQ futures close of 29,626 and the contract’s $20 multiplier, that equals −$16.3 billion of notional exposure, down $7.9 billion in one week. It is the most net-short dollar exposure in the chart’s 2019–present window.
as of Aug 11, 2026 (CFTC)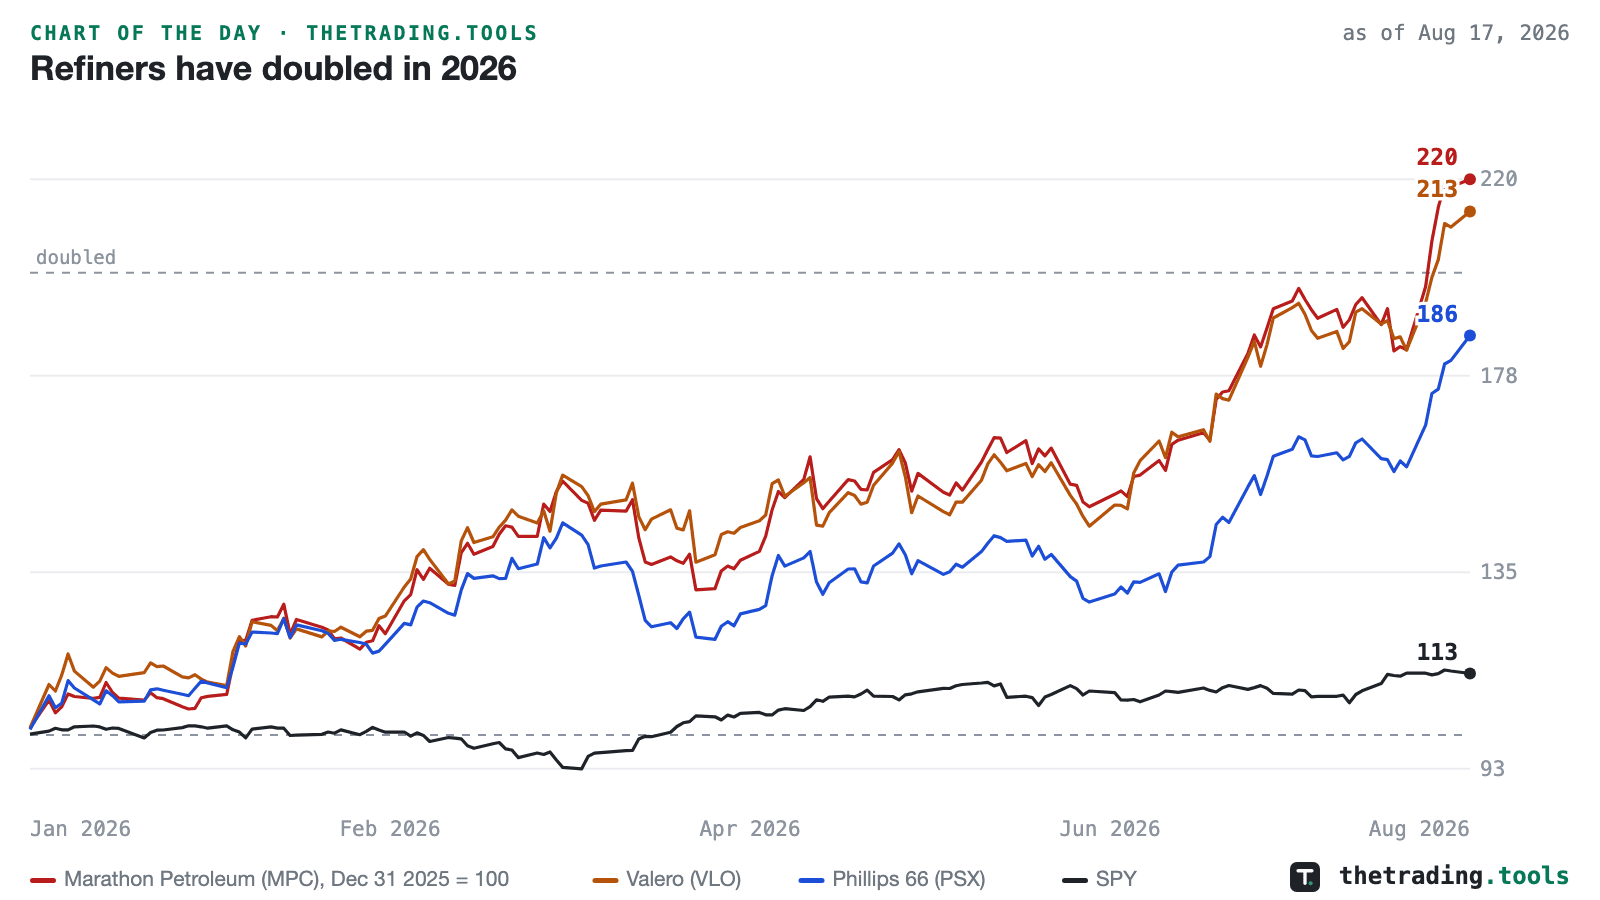
Refiners have doubled in 2026
Marathon Petroleum closed at $358.18 on Monday, up 120% from its December 31 close. Valero is up 113% and Phillips 66 up 86% over the same stretch, and all three set fresh 52-week highs after gaining 10% to 12% in a week. SPY is up 13% year to date, so the three refiners have added roughly nine times the index return.
as of 2026-08-17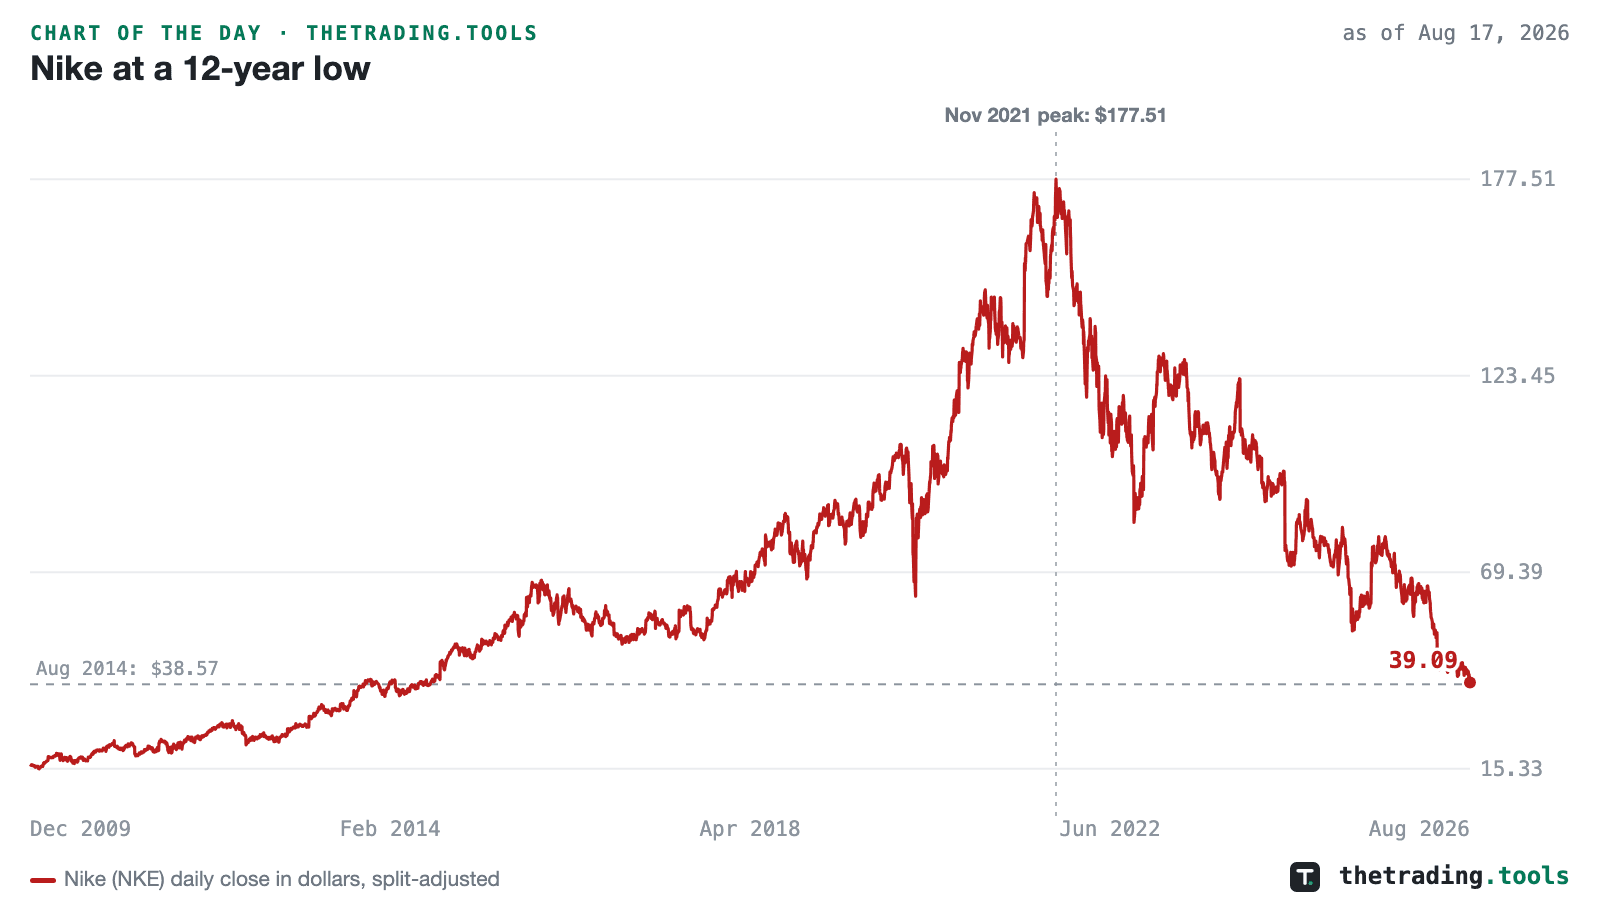
Nike at a 12-year low
Nike closed at $39.09 on Monday, its lowest close since August 15, 2014, and a fresh 52-week low. The stock is down 78% from its November 5, 2021 peak of $177.51 on a split-adjusted basis. The selling is not confined to one name: over the past five sessions Coach parent TPR lost 22%, On Holding 19% and YETI 18%.
as of 2026-08-17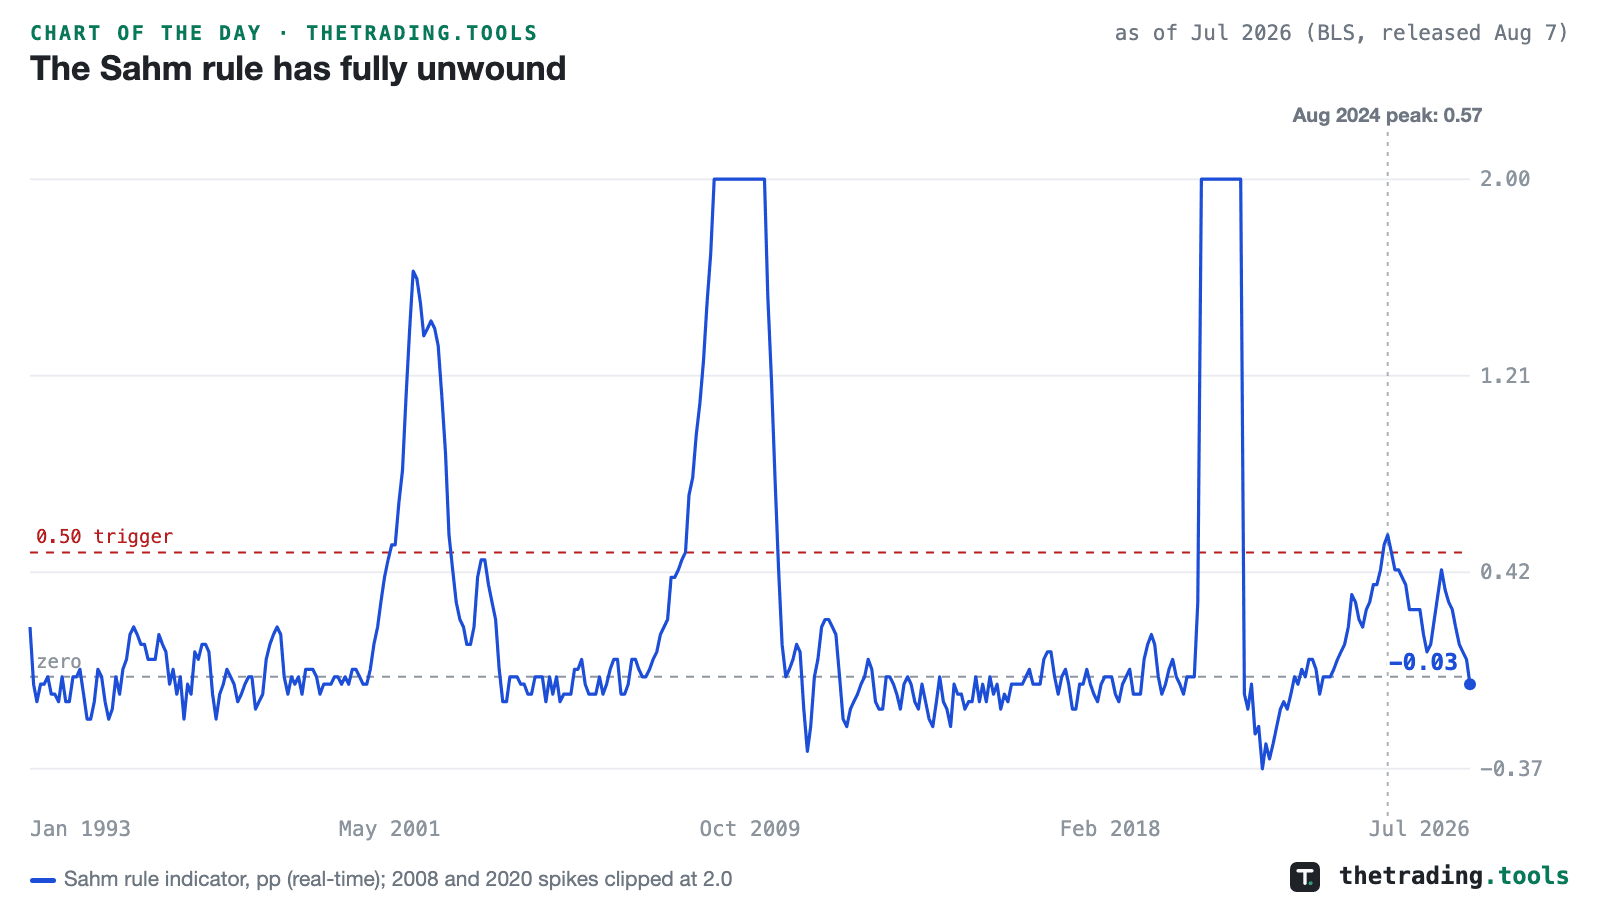
The Sahm rule has fully unwound
The real-time Sahm rule indicator printed −0.03 for July, its first negative reading since January 2023. It crossed the 0.50 trigger at 0.53 in July 2024 and peaked at 0.57 that August, the threshold Claudia Sahm designed to flag every US recession since 1970. A negative reading means the three-month average unemployment rate now sits below its low of the prior 12 months.
as of Jul 2026 (BLS via FRED, released Aug 7)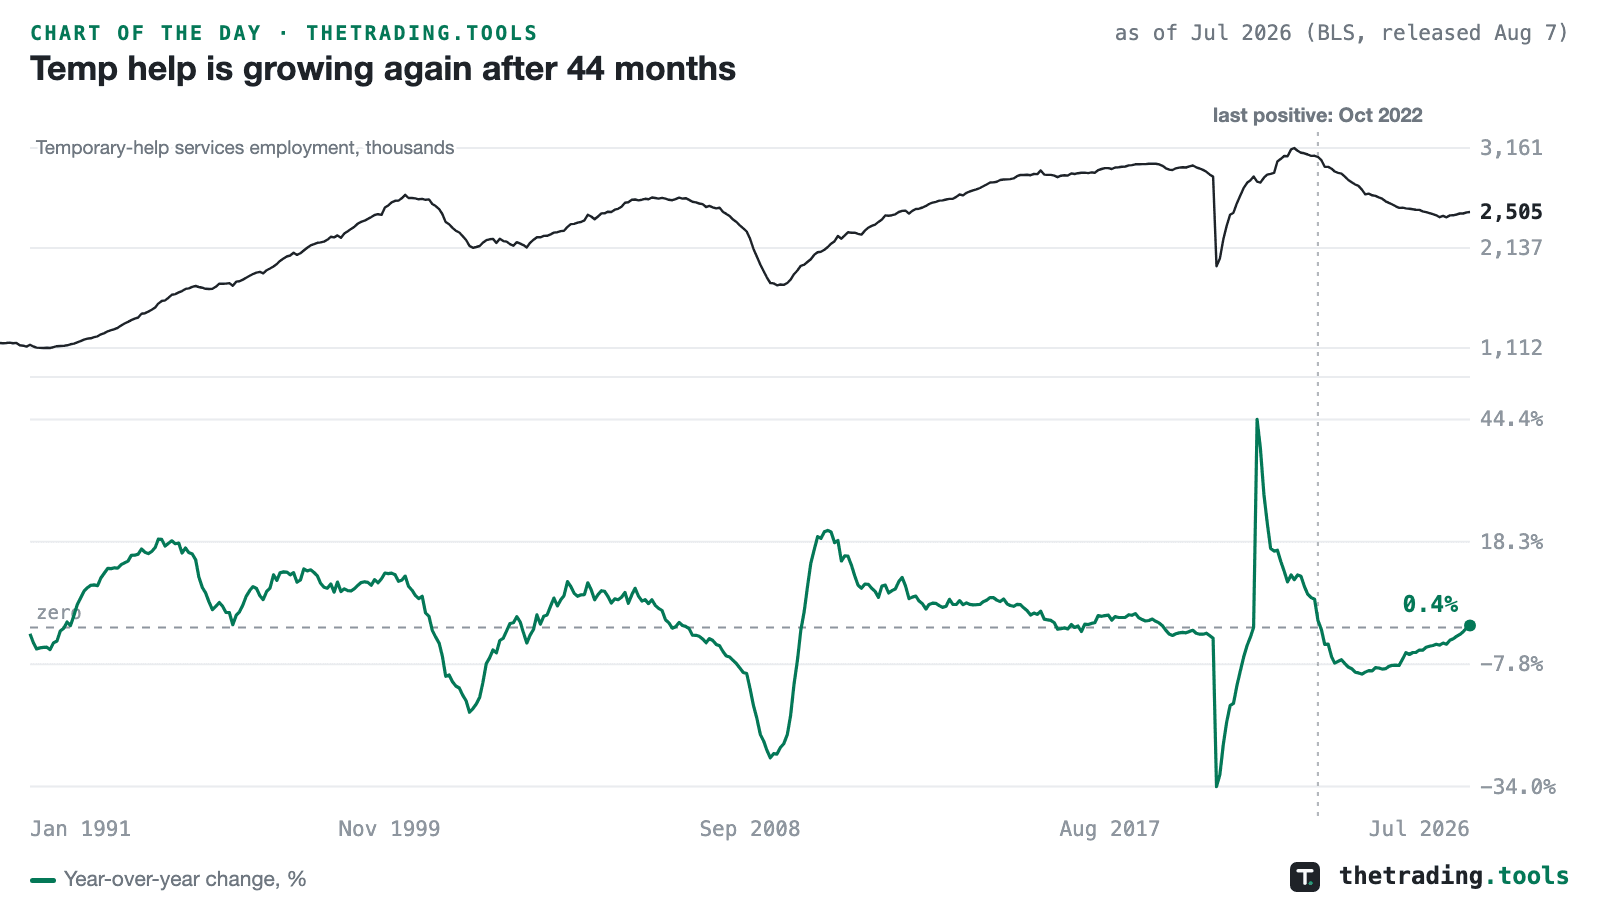
Temp help is growing again after 44 months
Temporary-help services employment was 0.4% higher in July than a year earlier, the first positive year-over-year reading since October 2022. The 44 consecutive months of declines from November 2022 through June 2026 were the longest such streak in the series, which begins in 1990. The level, 2.51 million jobs, remains 21% below the March 2022 peak of 3.16 million.
as of Jul 2026 (BLS, released Aug 7)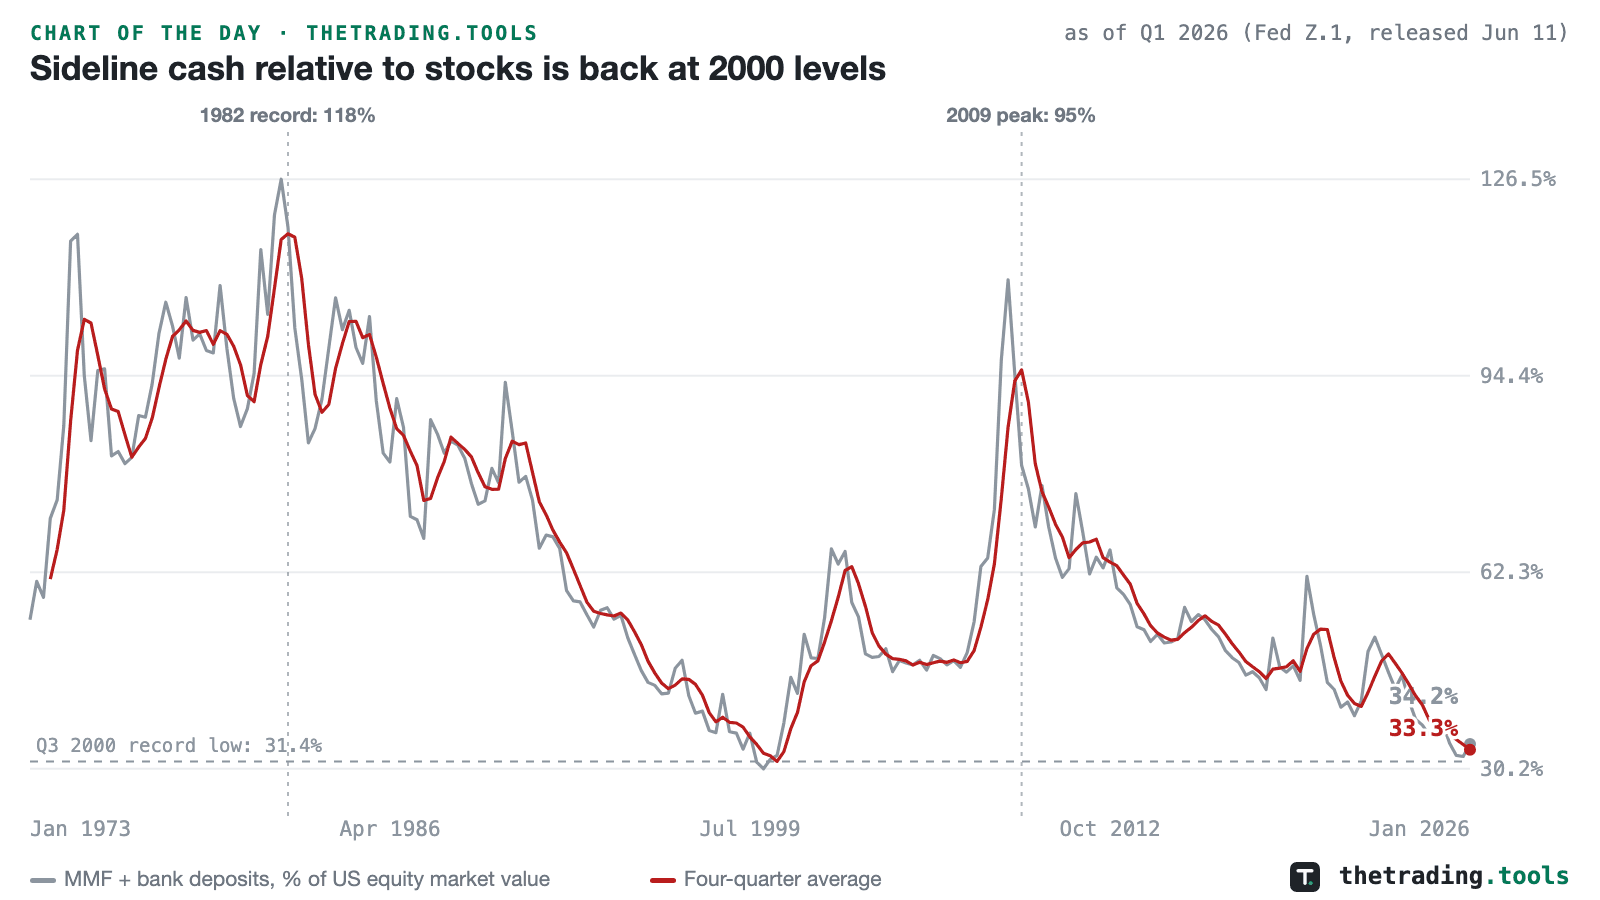
Sideline cash relative to stocks is back at 2000 levels
Money-market funds and bank deposits held $27.3 trillion at the end of the first quarter, against $79.7 trillion of US corporate equity market value. That puts sideline cash at 34% of the stock market; the four-quarter average of 33.3% is the lowest since the fourth quarter of 2000 and sits just above the 31.4% record low set in the third quarter of 2000. The 1982 record was 118%.
as of Q1 2026 (Fed Z.1 and H.8, ICI; released Jun 11)Friday, August 14, 2026
6 charts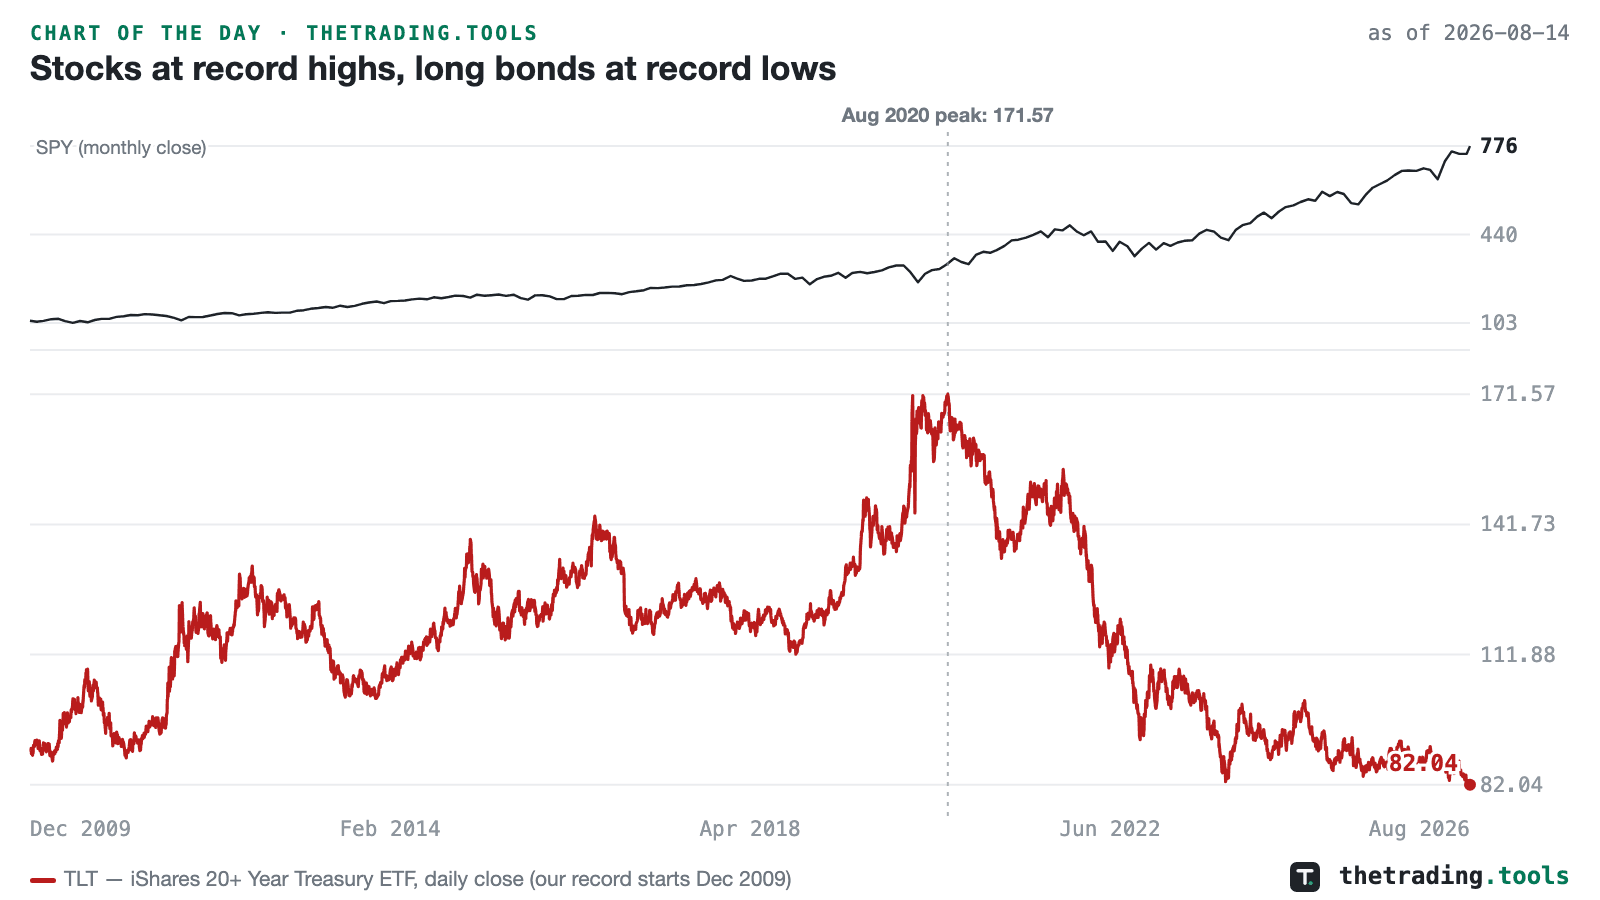
Stocks at record highs, long bonds at record lows
TLT, the 20+ year Treasury ETF, closed at 82.04 on Thursday: the lowest close in our record, which reaches back to December 2009, and its fourth record low in three weeks. It has now lost 52% from the August 2020 peak. The same session, equal-weight RSP, small-cap IWM and industrial XLI closed at record highs, and SPY finished 0.2% below the record close it set a day earlier.
as of 2026-08-14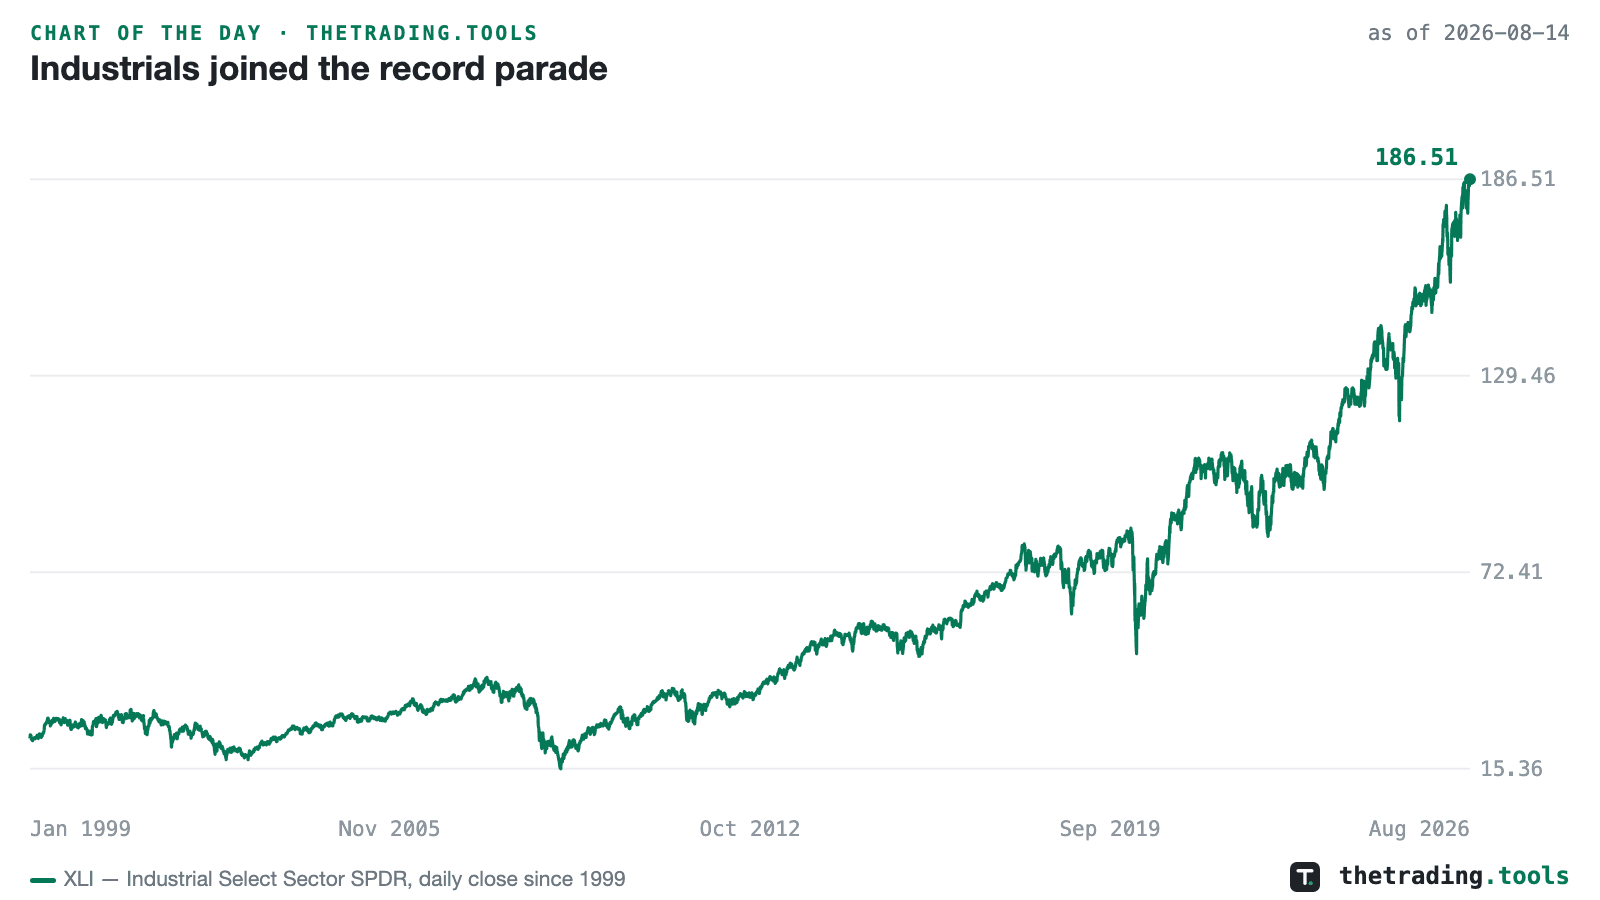
Industrials joined the record parade
XLI, the industrial sector SPDR, closed at an all-time high of 186.51 on Thursday — its second record close this month in a history that reaches back to 1999. Equal-weight RSP and small-cap IWM set records the same session, with SPY 0.2% off Wednesday’s record close.
as of 2026-08-14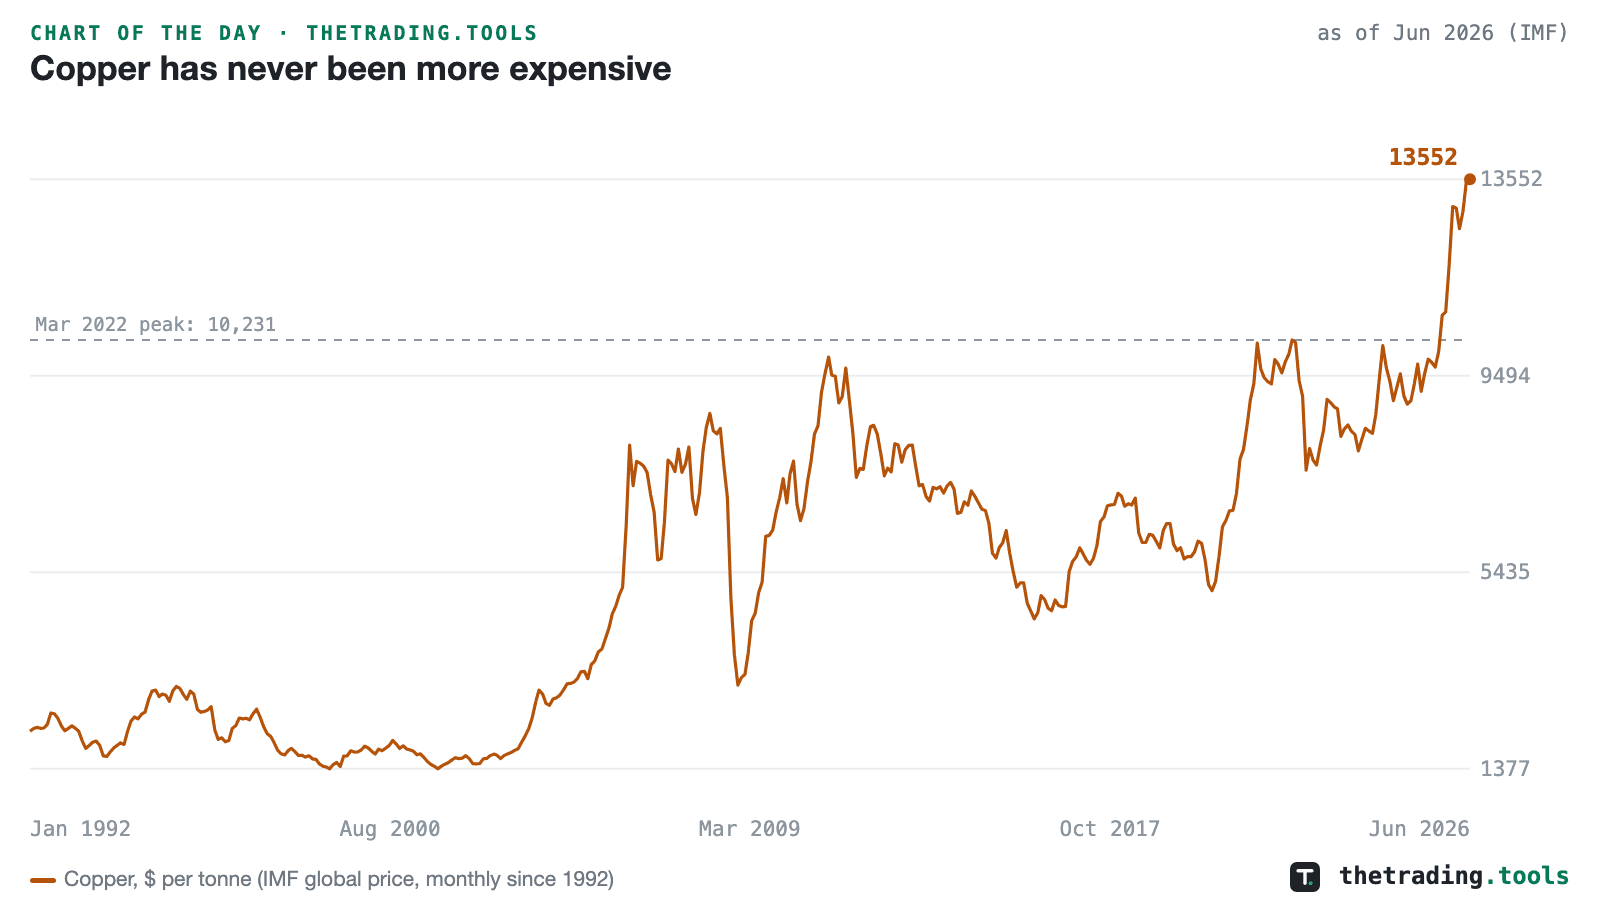
Copper has never been more expensive
Copper reached $13,552 per tonne in June, a record in the IMF global price series that starts in 1992, and 32% above the previous record of $10,231 set in March 2022. The old peak was a spike; the current level came from a year of nearly uninterrupted climbing.
as of Jun 2026 (IMF)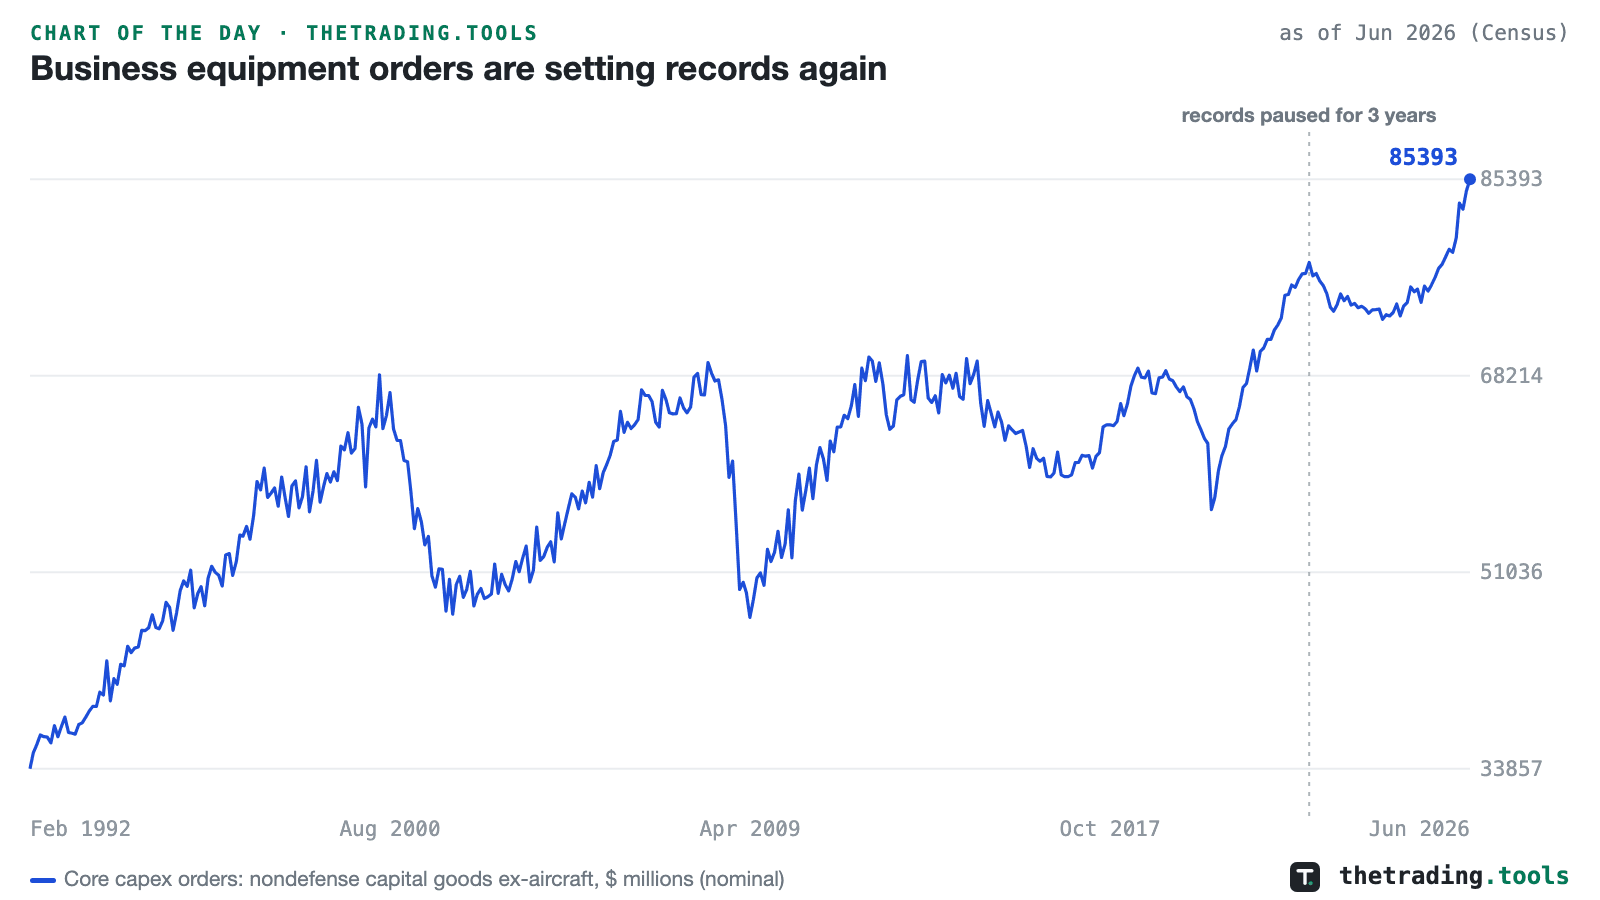
Business equipment orders are setting records again
Core capex orders (nondefense capital goods excluding aircraft, the cleanest monthly read on business equipment investment) reached a record $85.4 billion in June. After the August 2022 record, the series went three years without a new high; since November 2025 it has set six.
as of Jun 2026 (Census)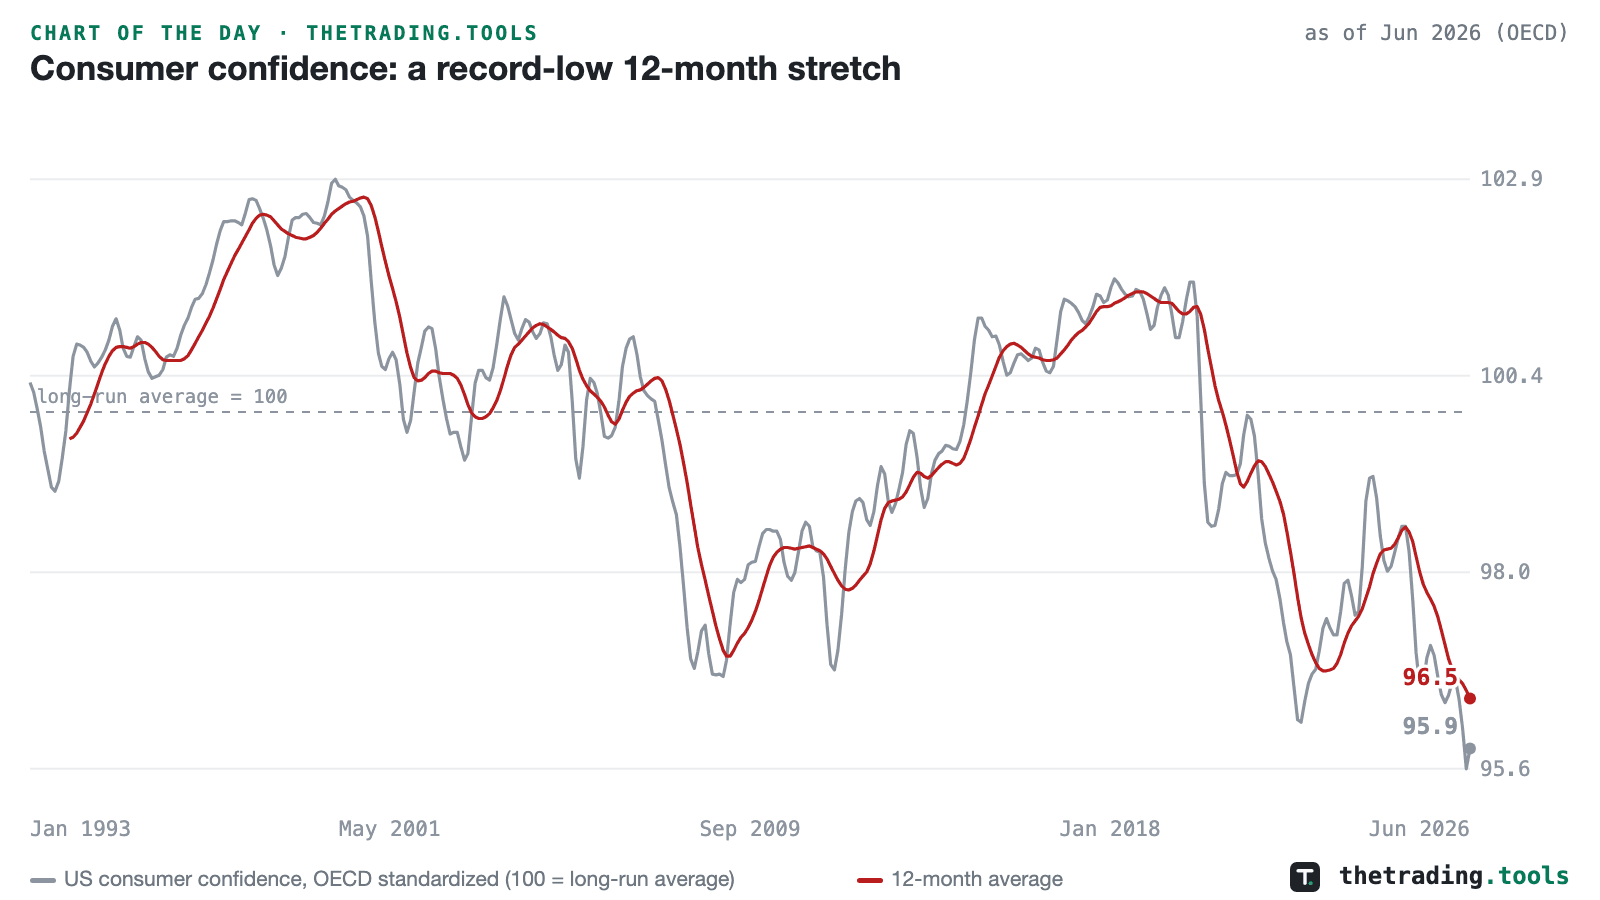
Consumer confidence: a record-low 12-month stretch
The OECD’s standardized index of US consumer confidence, scaled so 100 is the long-run average, printed 95.9 in June, and its 12-month average fell to 96.5, the lowest in the series’ 32 years. The raw index set its own record low a month earlier. This is a second, independently built gauge confirming what Michigan sentiment shows: the sourest sustained consumer mood on record.
as of Jun 2026 (OECD)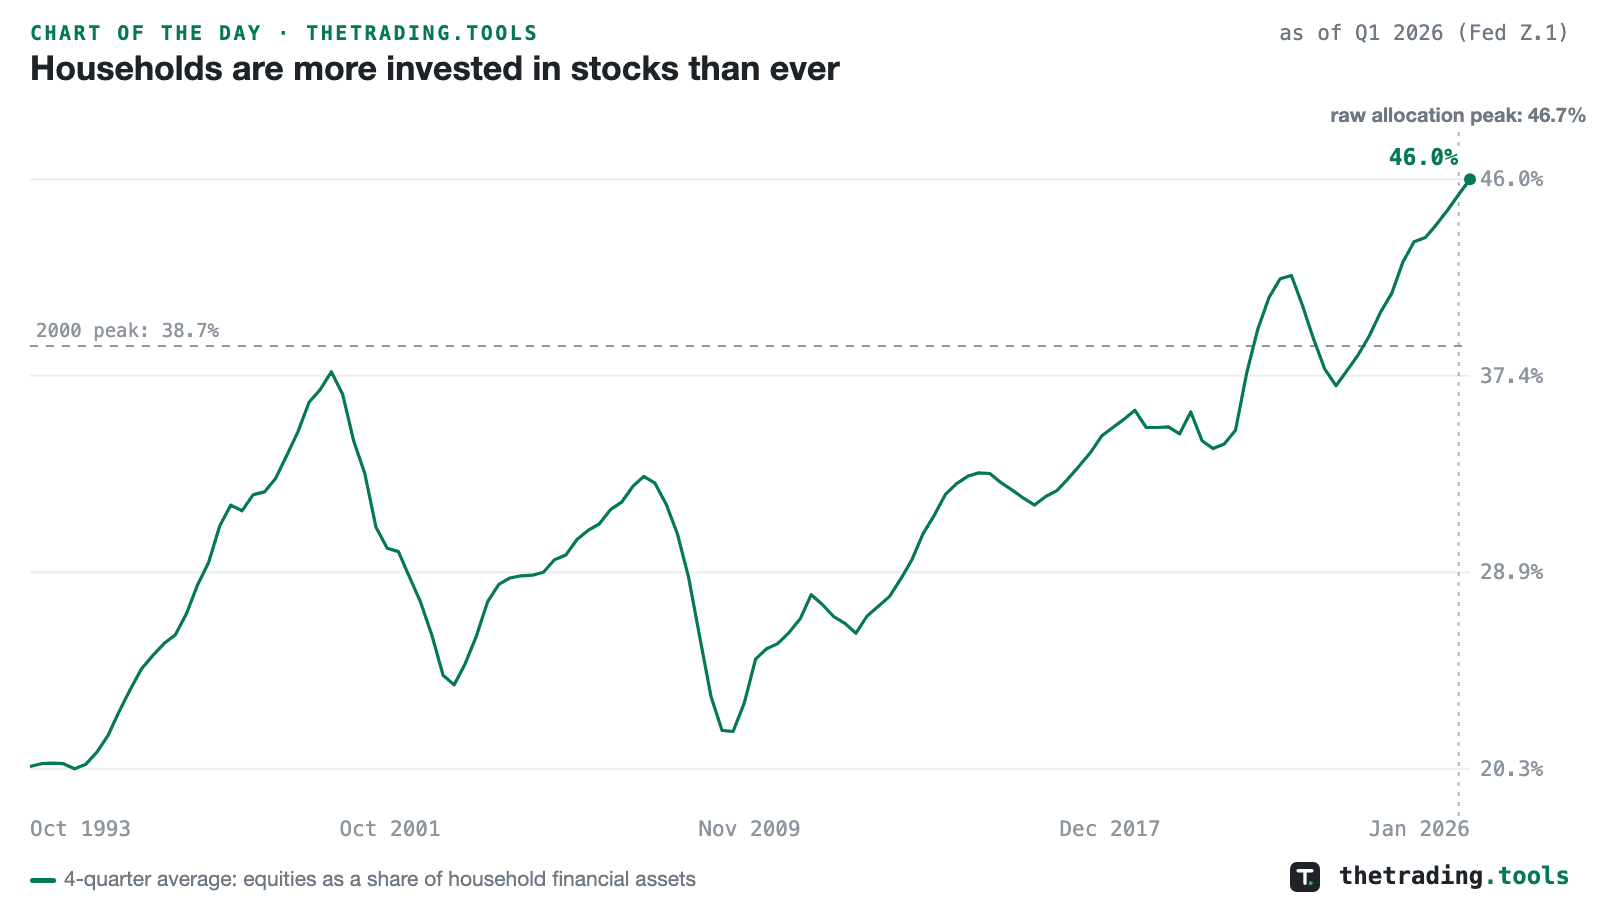
Households are more invested in stocks than ever
The four-quarter average of household equity allocation reached 46.0% in Q1, the highest in the 33-year Federal Reserve series. The current quarterly reading is 45.8%, just below the 46.7% raw peak in Q4 2025, but smoothing out that quarterly price move leaves the underlying allocation at a record. The dot-com high was 38.7%.
as of Q1 2026 (Fed Z.1)Thursday, August 13, 2026
6 charts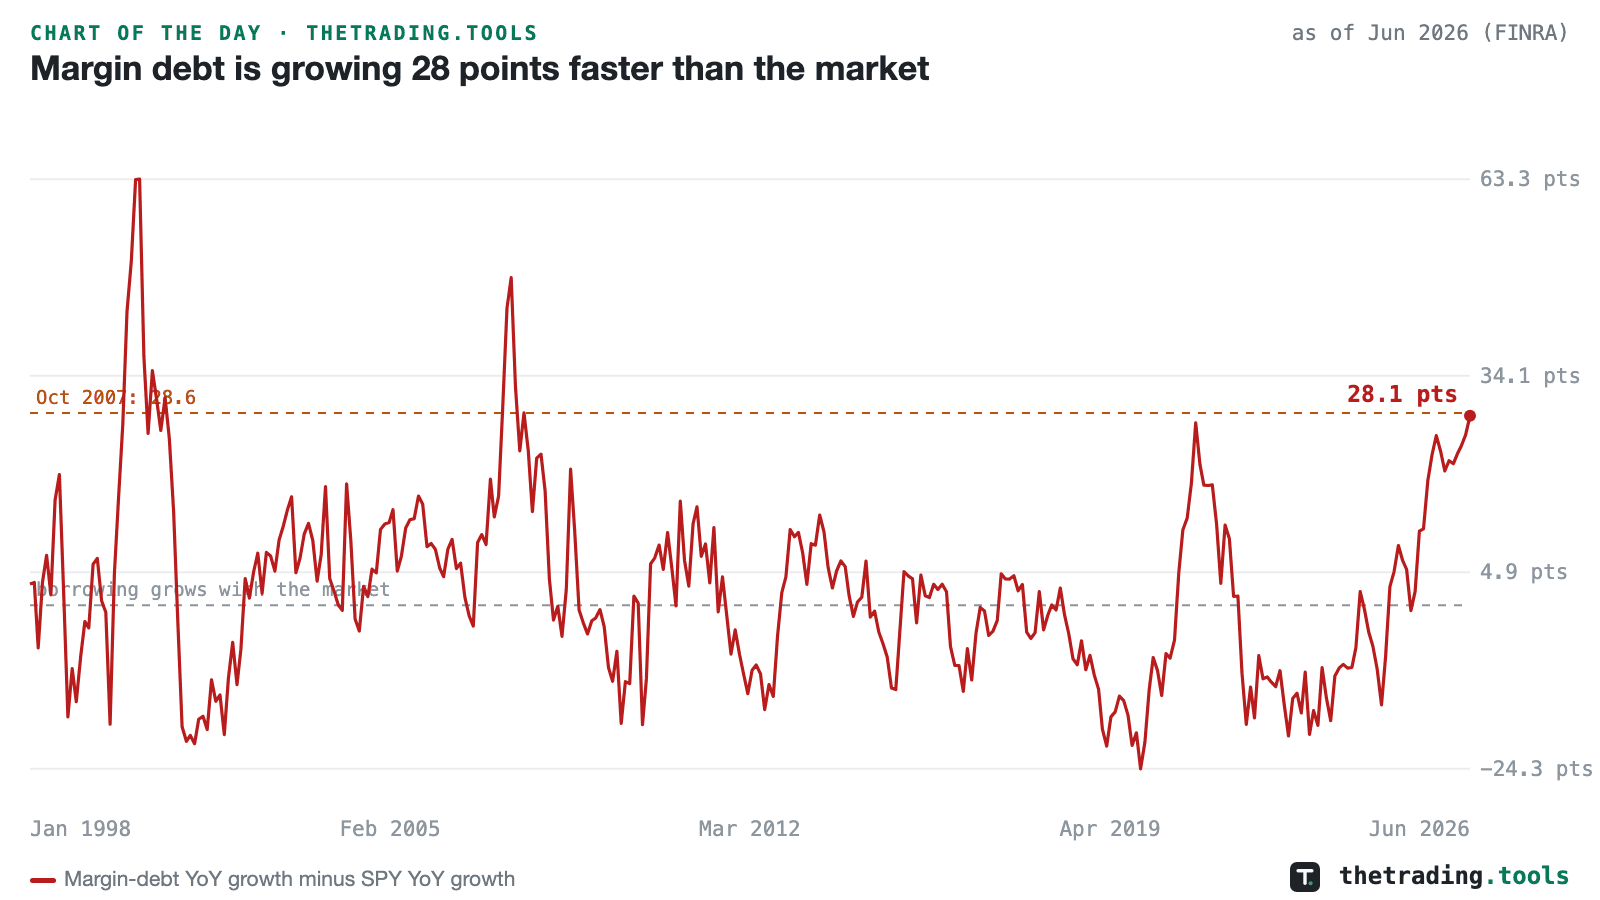
Margin debt is growing 28 points faster than the market
FINRA margin debt reached a record $1.50 trillion in June 2026, up 49% from a year earlier, while SPY rose 21% over the same twelve months. Borrowing outgrowing the market by 28 points is the widest gap since October 2007, when it touched 28.6.
as of Jun 2026 (FINRA)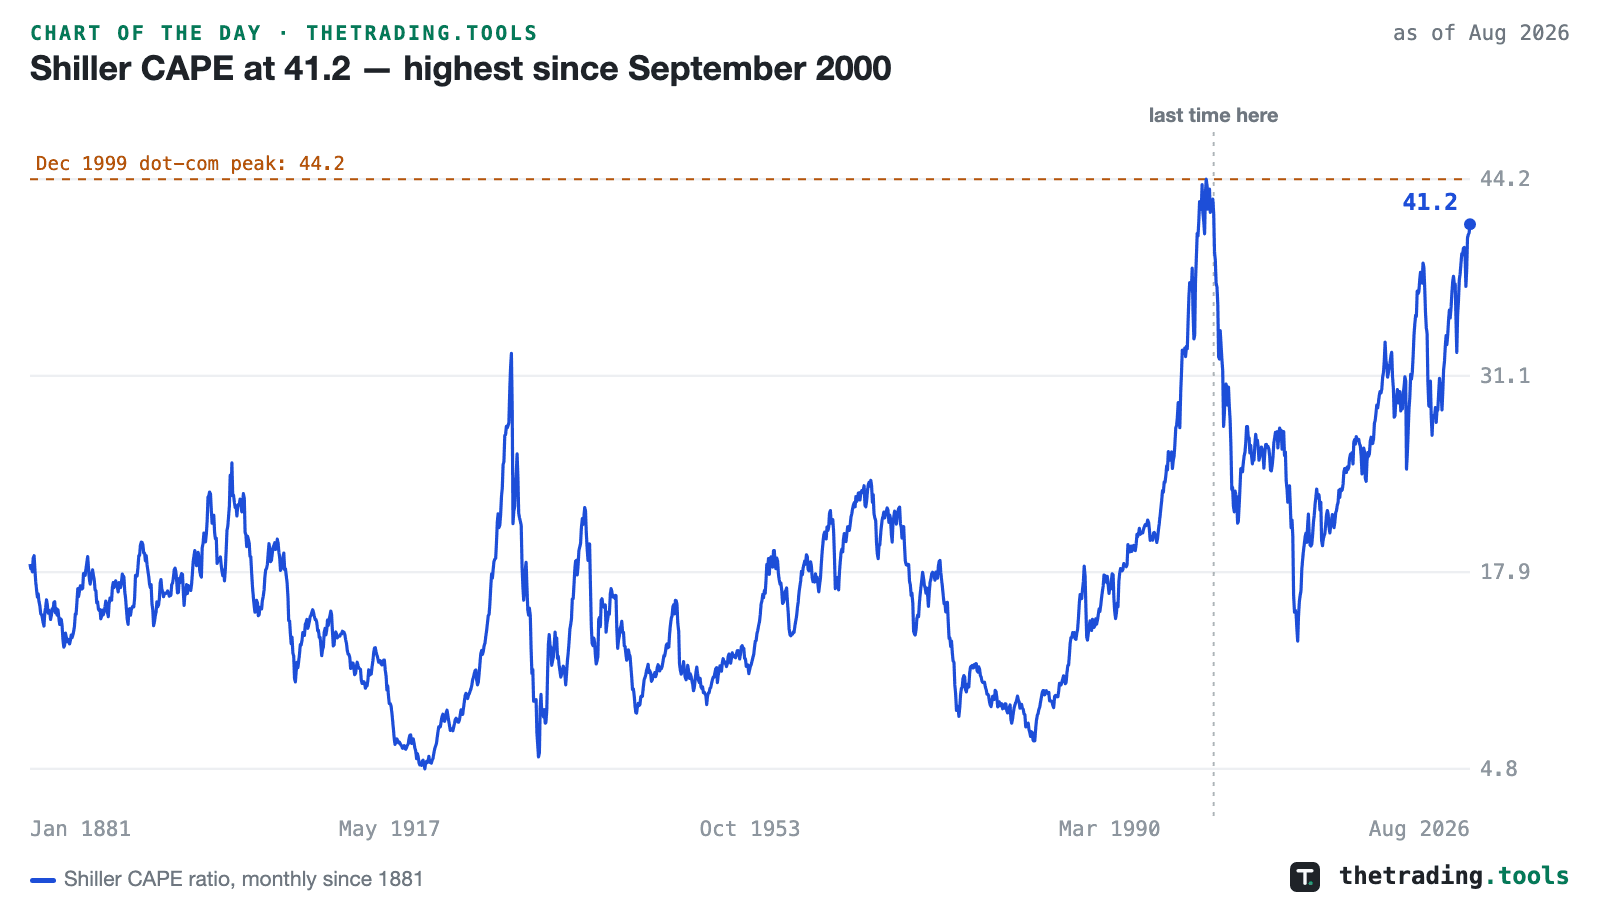
Shiller CAPE at 41.2 — highest since September 2000
The Shiller CAPE ratio — price over the 10-year average of inflation-adjusted earnings — reached 41.2 in August 2026. The last month at or above this level was September 2000. In 145 years of monthly data, only the dot-com peak months rank higher, topping out at 44.2 in December 1999.
as of Aug 2026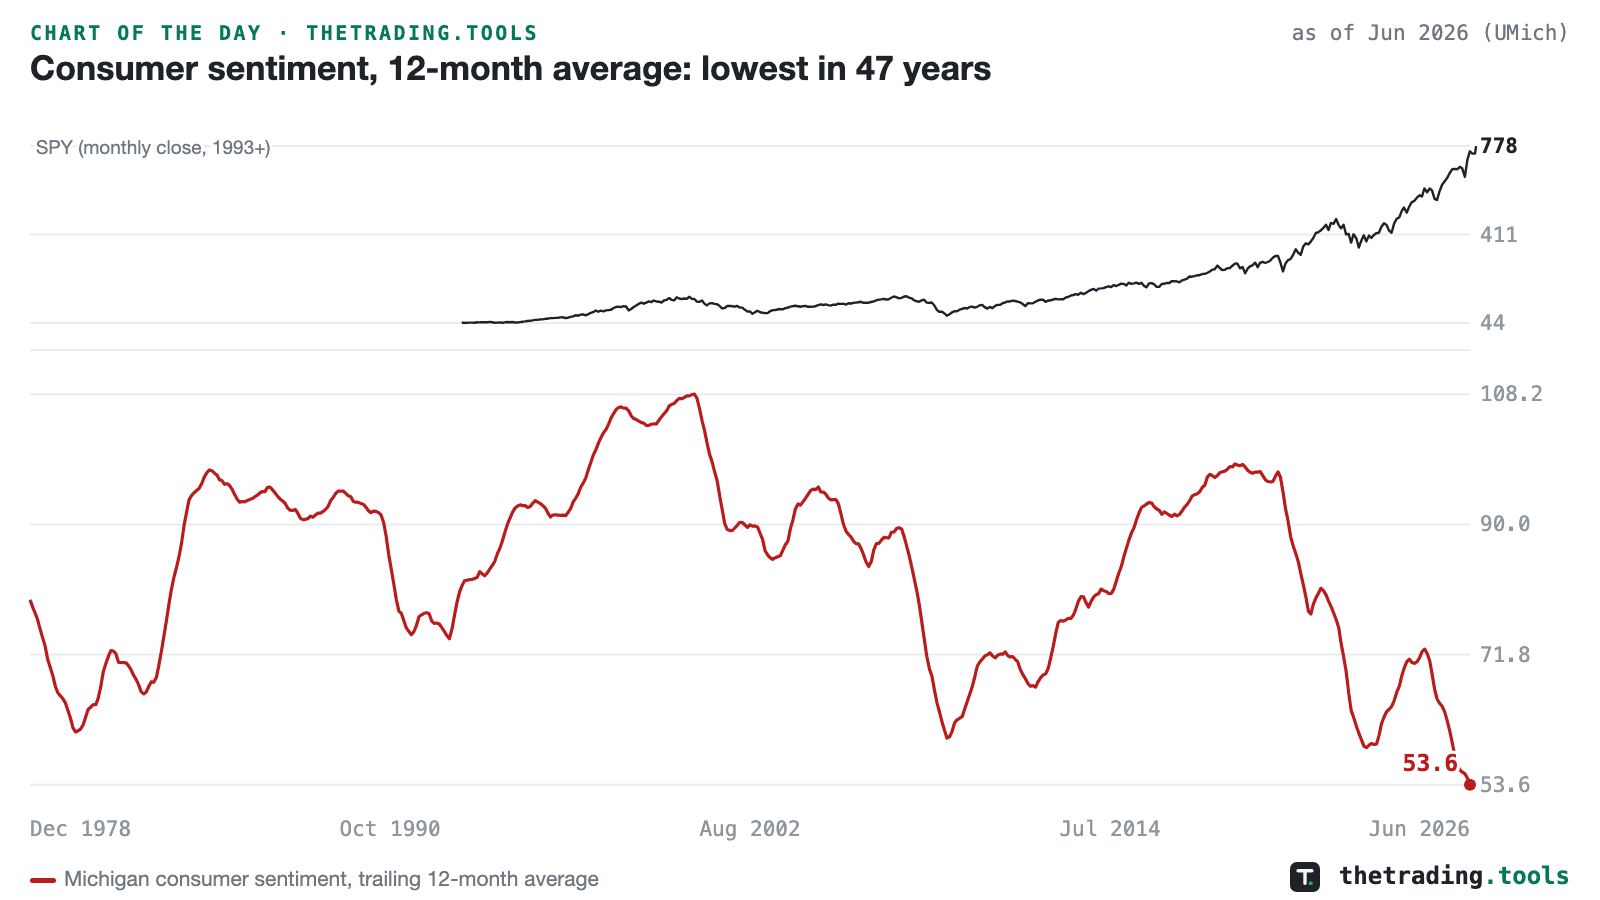
Consumer sentiment, 12-month average: lowest in 47 years
SPY closed at an all-time high this week. Meanwhile the trailing 12-month average of Michigan consumer sentiment sits at 53.6, the lowest reading in the 47 years that average can be computed, below the troughs of 1980, 2008 and 2022.
as of Jun 2026 (UMich)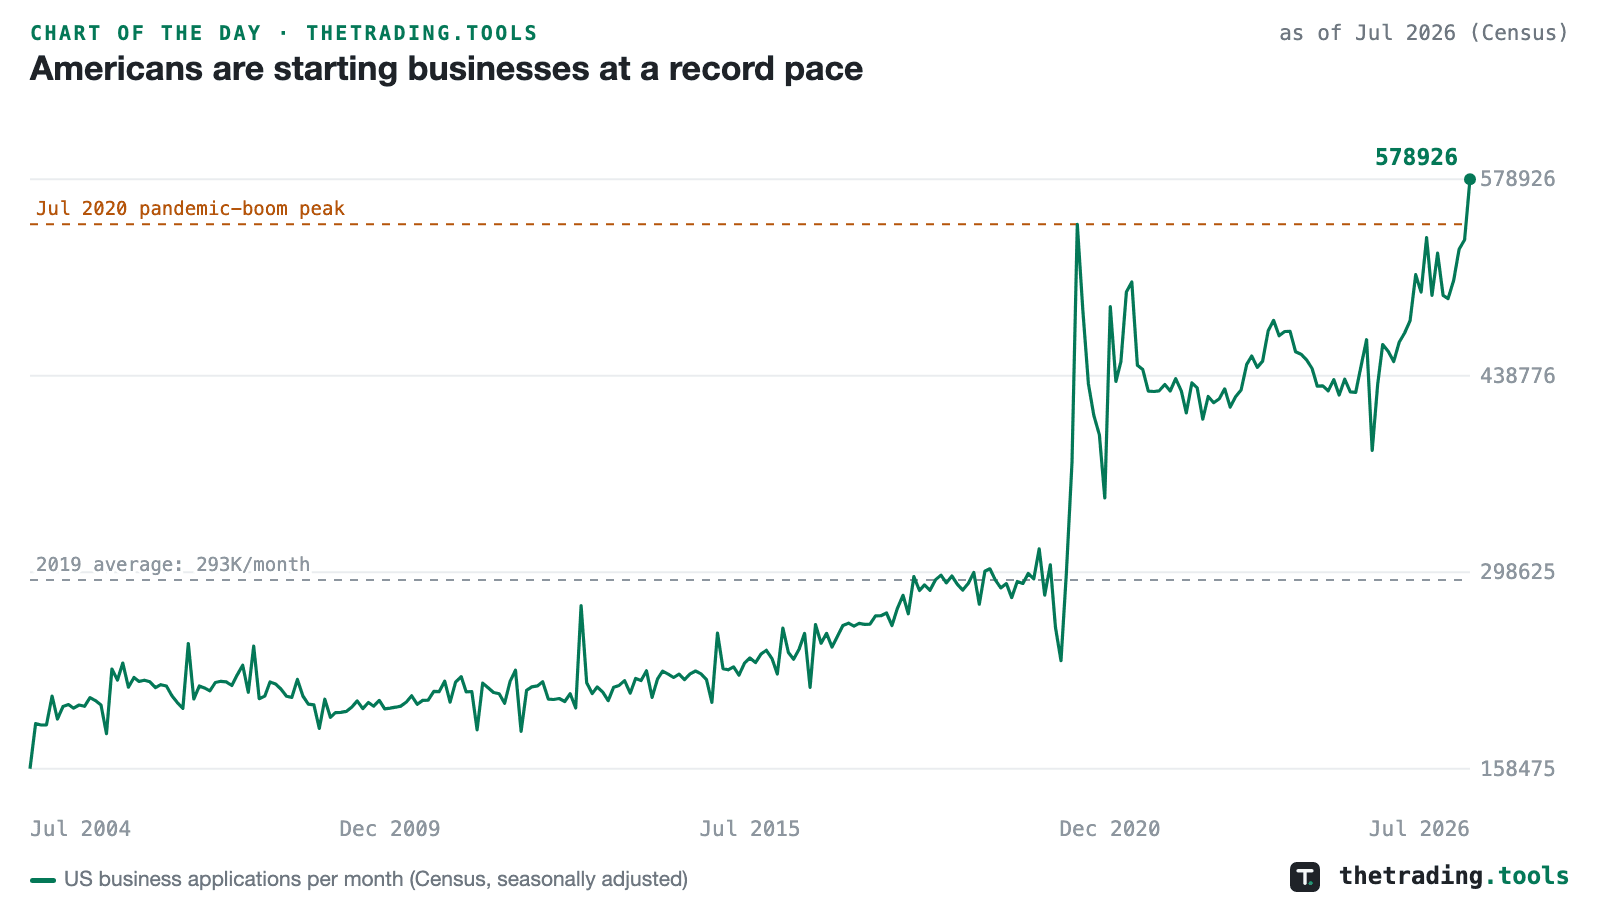
Americans are starting businesses at a record pace
Americans filed 578,926 new business applications in July, the most in the 22 years the Census Bureau has tracked the series. The previous record was July 2020 (546,719), the peak of the pandemic startup wave; the 2019 average was 293K a month, roughly half the current pace.
as of Jul 2026 (Census)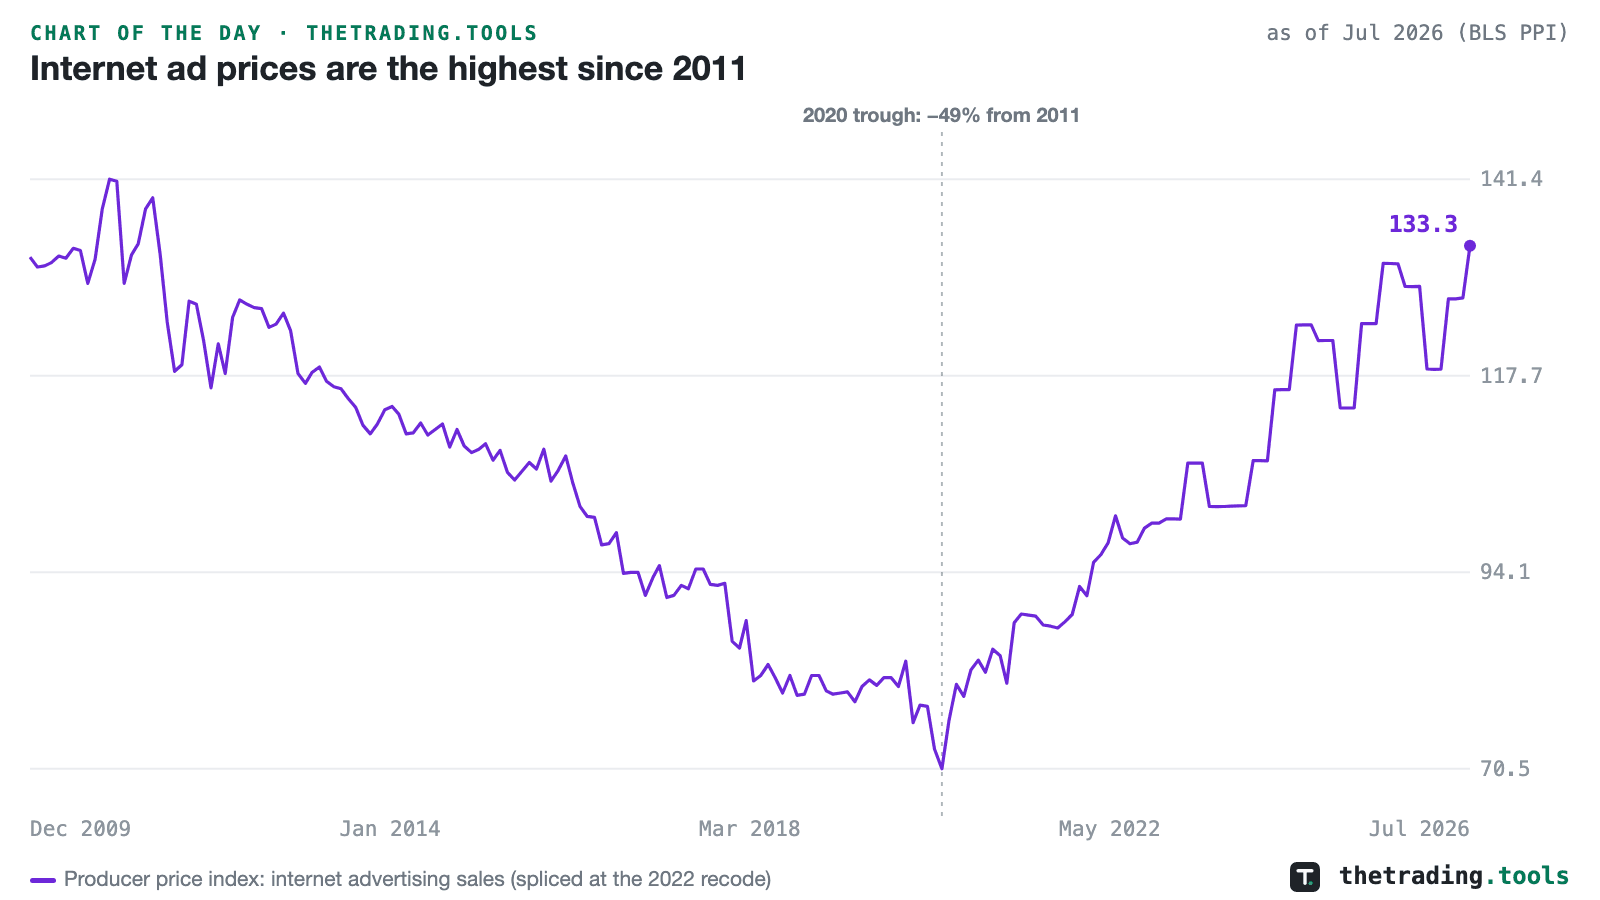
Internet ad prices are the highest since 2011
The producer price index for internet advertising sales reached 133.3 in July, the highest since May 2011. The decade of ad-price deflation is fully unwound: prices fell 49% from the 2011 peak to the June 2020 trough, and have risen 89% since.
as of Jul 2026 (BLS PPI)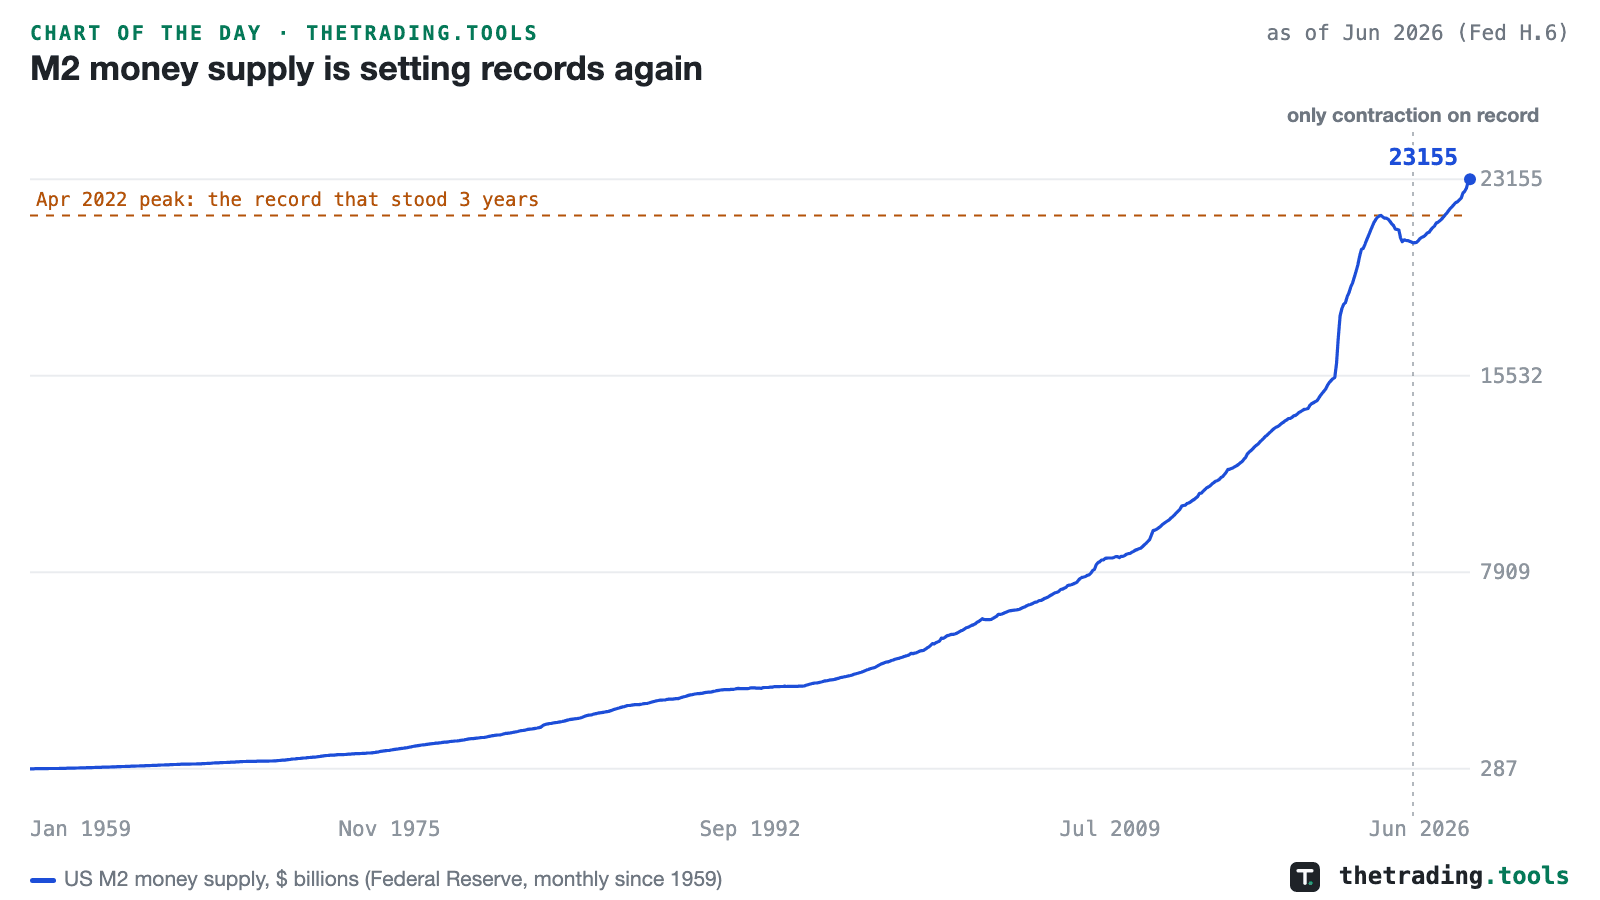
M2 money supply is setting records again
US M2 reached $23.2 trillion in June, its fifteenth consecutive record month. The April 2022 peak of $21.75 trillion stood for three years: M2 fell 4.9% into October 2023, the only sustained contraction in the 67-year record, then reclaimed the old high in April 2025. It now sits 6.5% above that peak and is growing 5.5% a year.
as of Jun 2026 (Fed H.6)