Sideline cash relative to stocks is back at 2000 levels
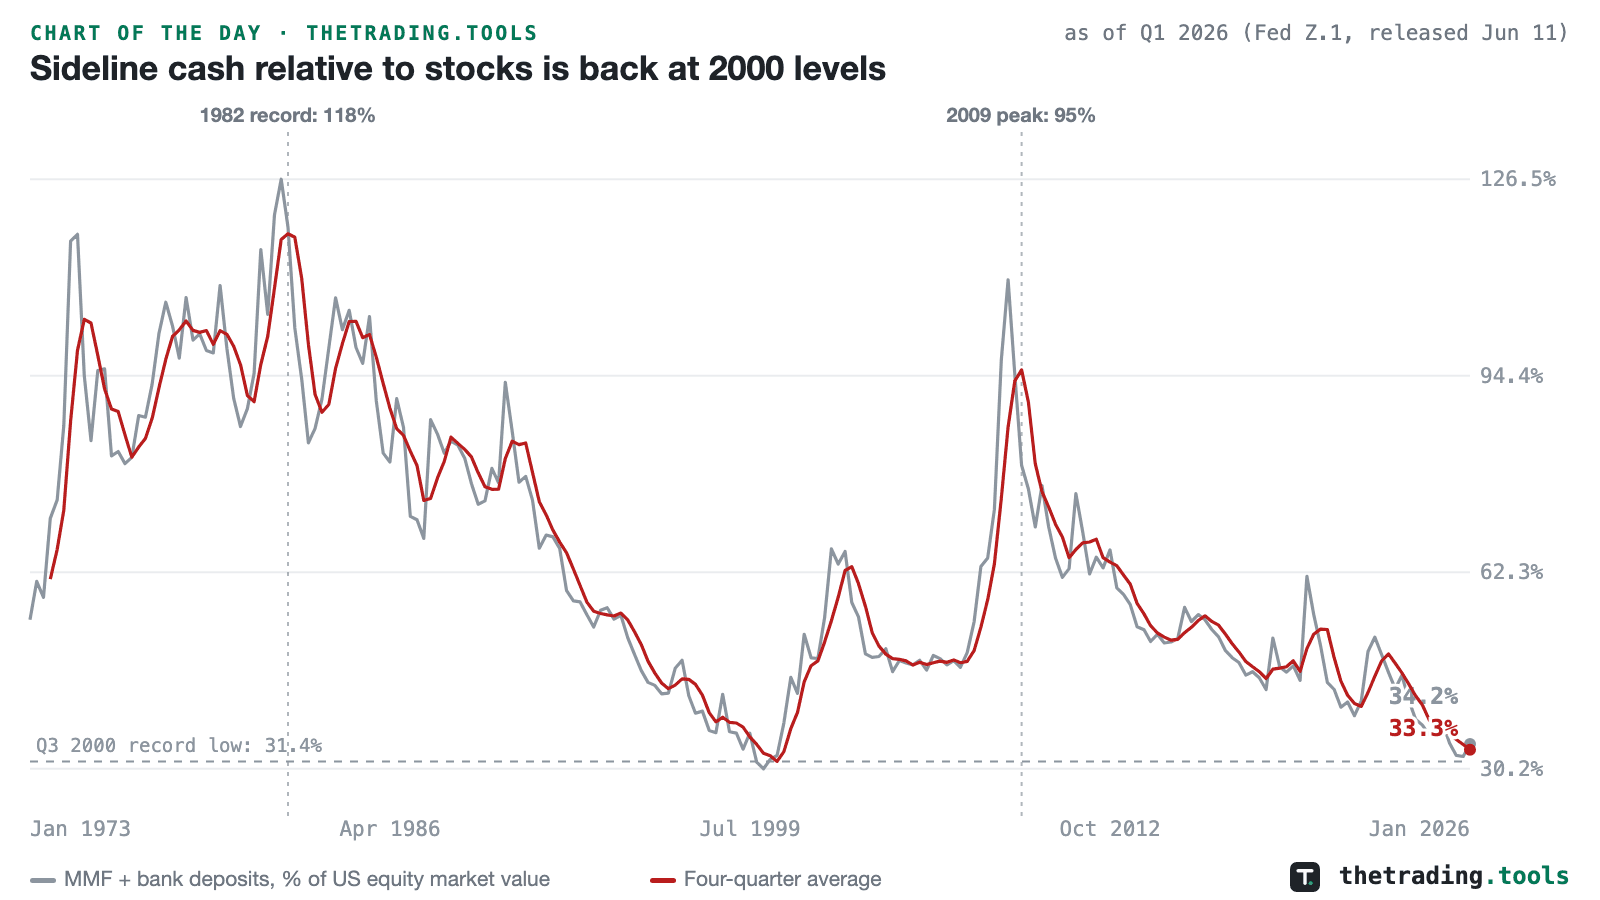
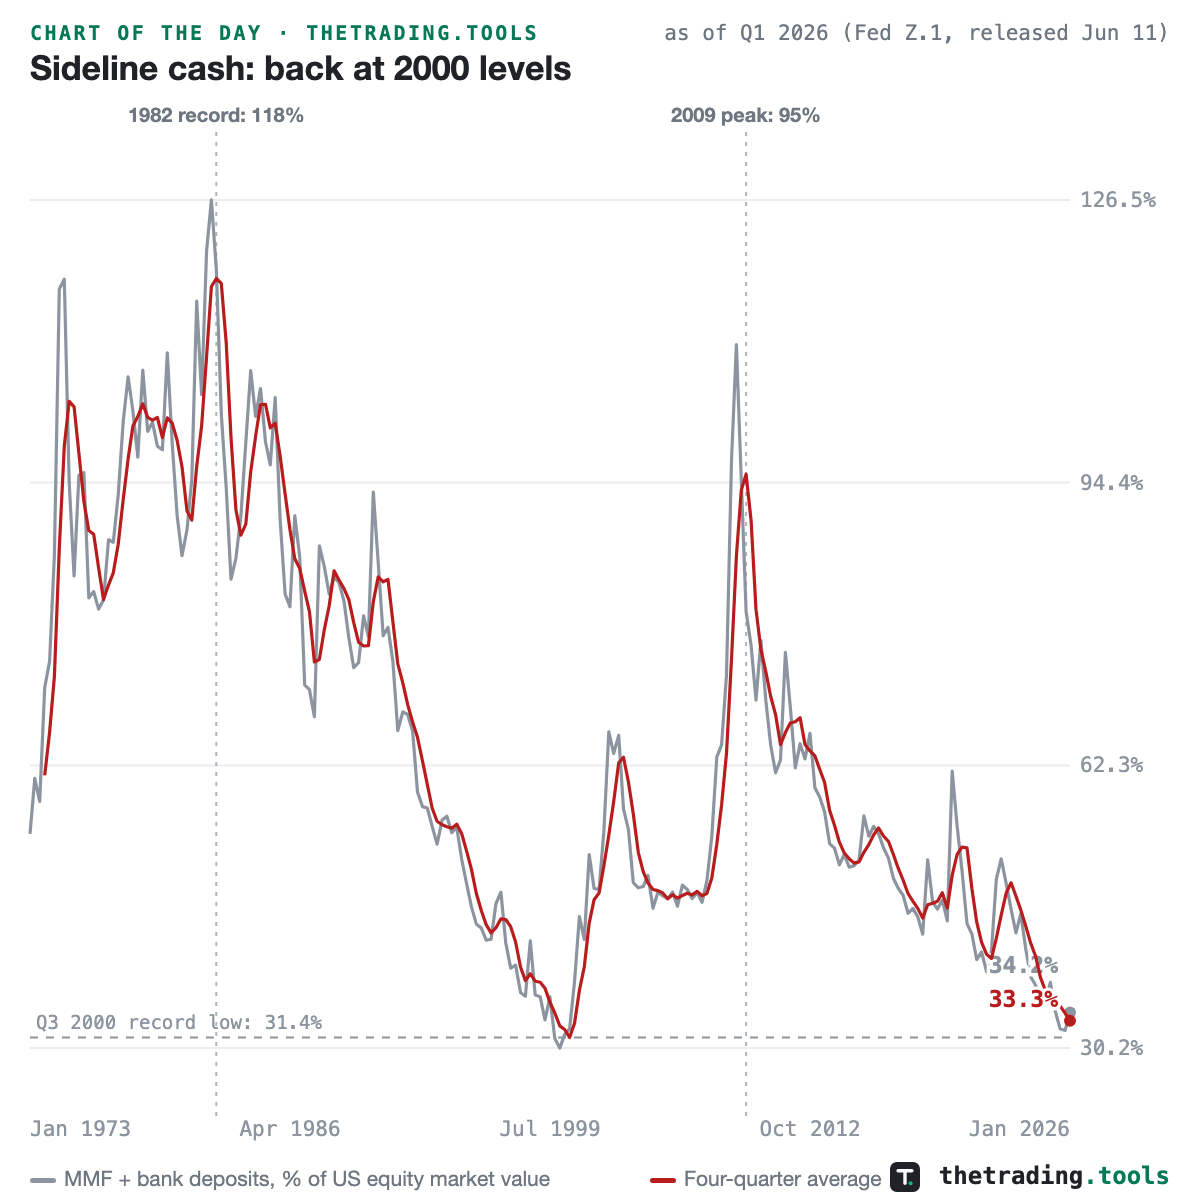
Money-market funds and bank deposits held $27.3 trillion at the end of the first quarter, against $79.7 trillion of US corporate equity market value. That puts sideline cash at 34% of the stock market; the four-quarter average of 33.3% is the lowest since the fourth quarter of 2000 and sits just above the 31.4% record low set in the third quarter of 2000. The 1982 record was 118%.
The cash never left. The pile has grown almost every year, and the ratio fell because equity values grew faster. Cash cannot flow into stocks in aggregate, since every buyer needs a seller, so this gauge tells you how far valuations have run rather than when they stop. The denominator is the Fed’s corporate equity series, which prints lower than an S&P 500 market cap version, but the extremes land in the same quarters.
Sideline Cash Ratio — full 1973+ history, components and the anti-narrative
This chart is a frozen capture — the numbers above are as of Q1 2026 (Fed Z.1 and H.8, ICI; released Jun 11) and will not update. The live page recomputes daily from the same dataset. A square version of this chart is available for feeds that crop landscape images.