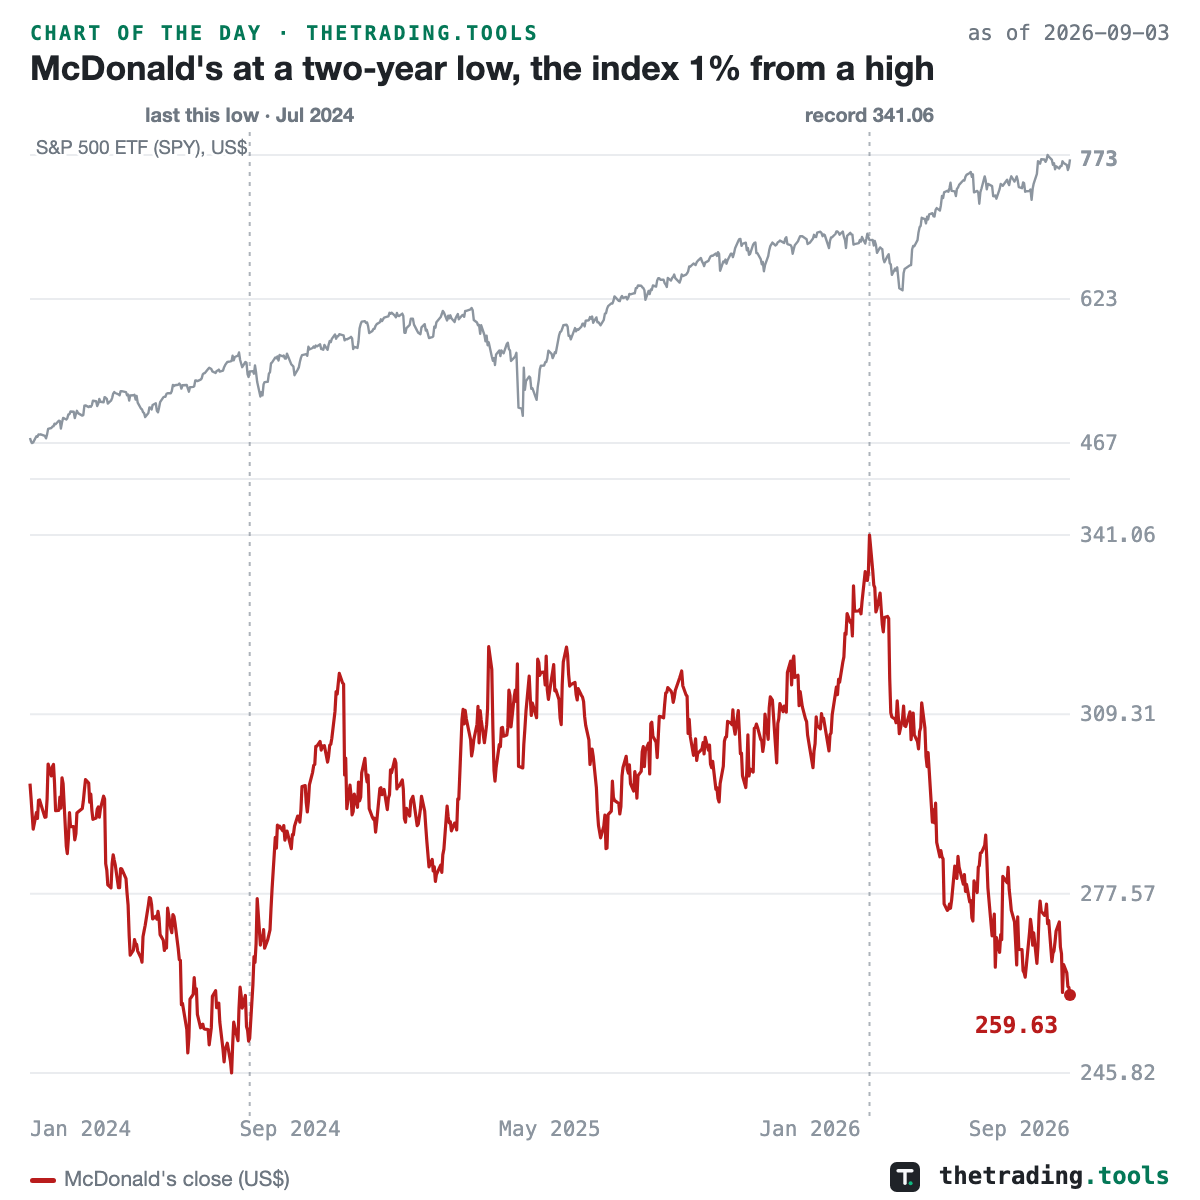
McDonald’s is at a two-year low while the S&P 500 sits about 1% from a high
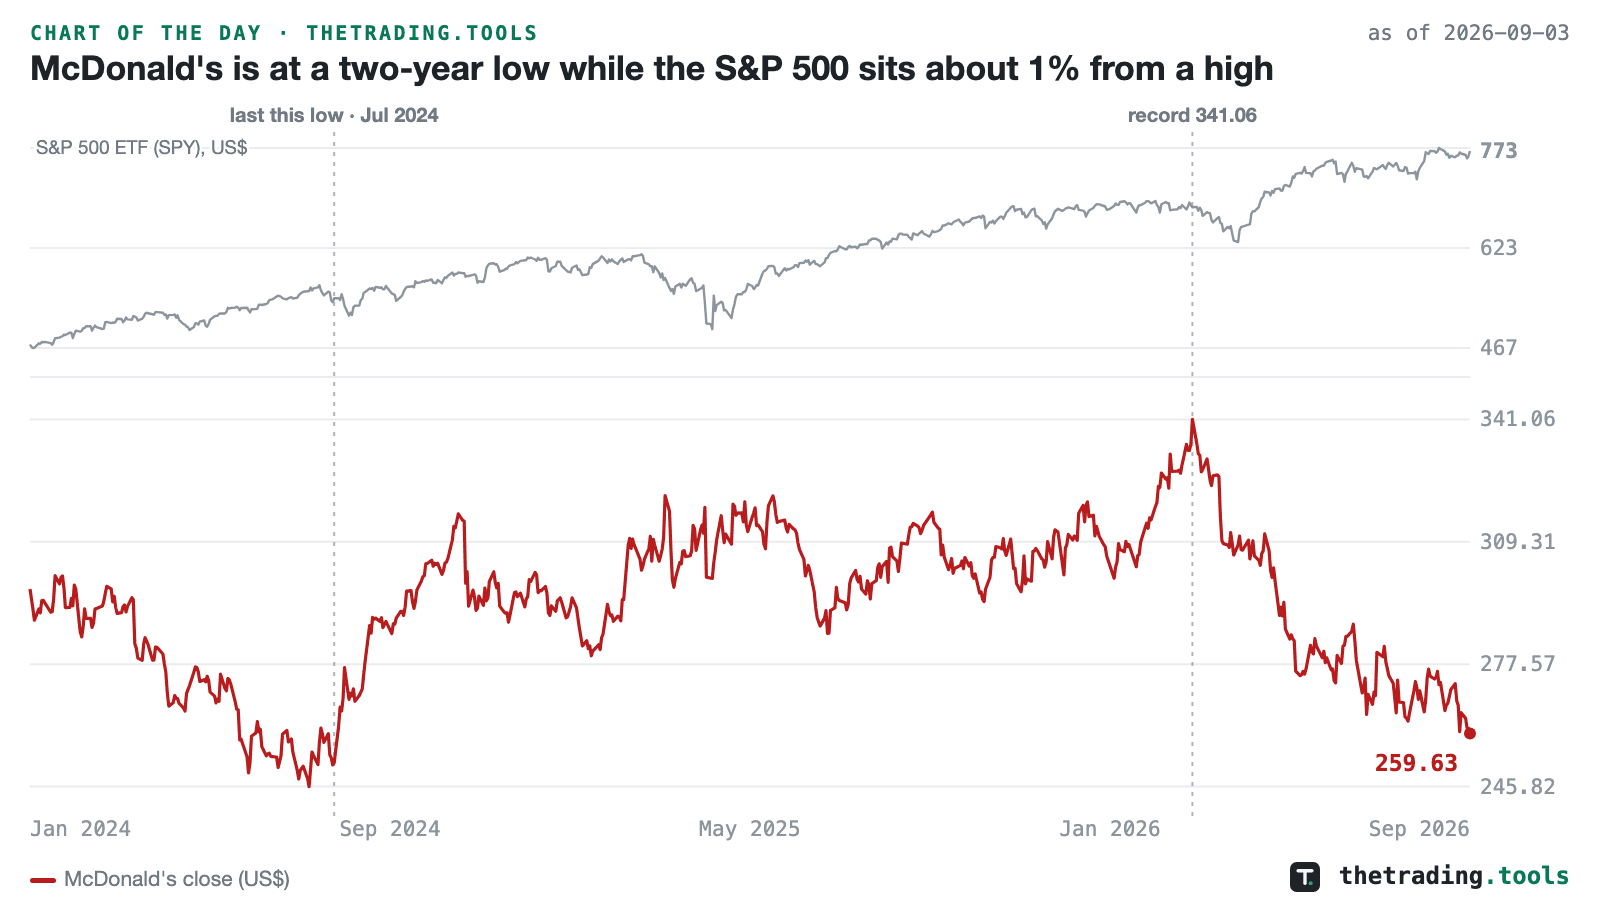
McDonald’s closed at $259.63 on September 3, 2026. That is its lowest close since July 26, 2024, and it sits 23.9% below the record close of $341.06 set on February 27 of this year. The stock is down 15.1% in 2026. The index it belongs to is not: SPY closed 0.6% from its high the same day and is up 13.4% on the year, so the whole of the decline is the company against its market.
The chart puts the two next to each other because the gap is the story. A quarter of the market value of one of the most defensive names in the index has gone in six months while the index made highs. Consumer sentiment’s 12-month average is at the low of its record, which was Monday’s chart, and this is one place the mood shows up in a price. The chart does not say whether the low holds. It says the market is separating this consumer from the index, and has been since February.
MCD — the full daily chart
This chart is a frozen capture — the numbers above are as of Sep 3, 2026 and will not update. The live page recomputes daily from the same dataset. A square version of this chart is available for feeds that crop landscape images.