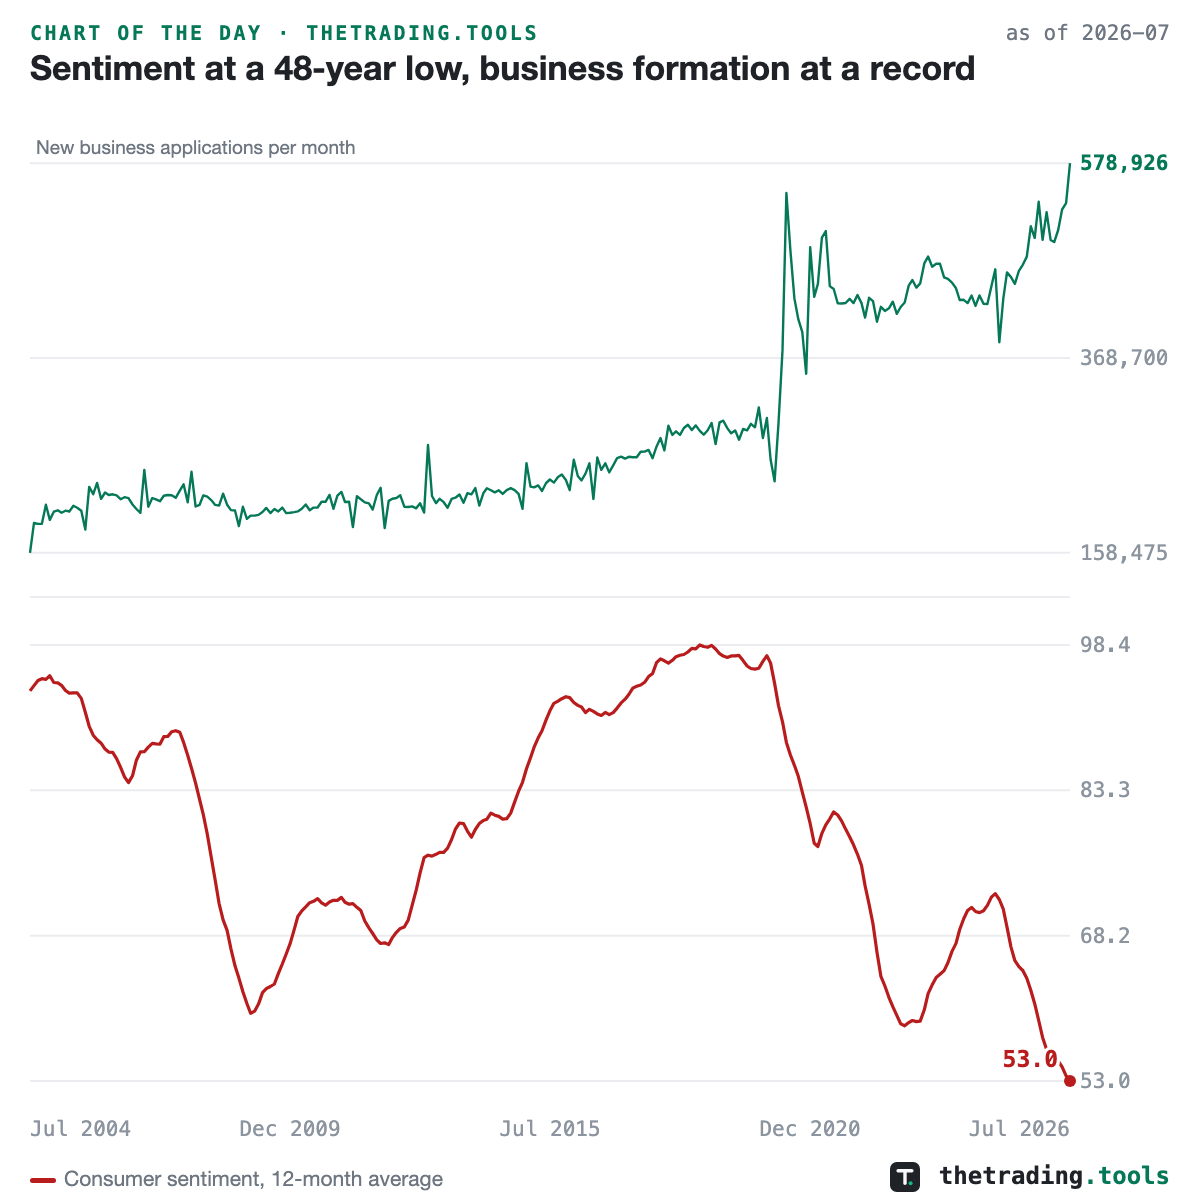
Sentiment is the lowest of its 48-year record. Business applications are the highest of theirs.
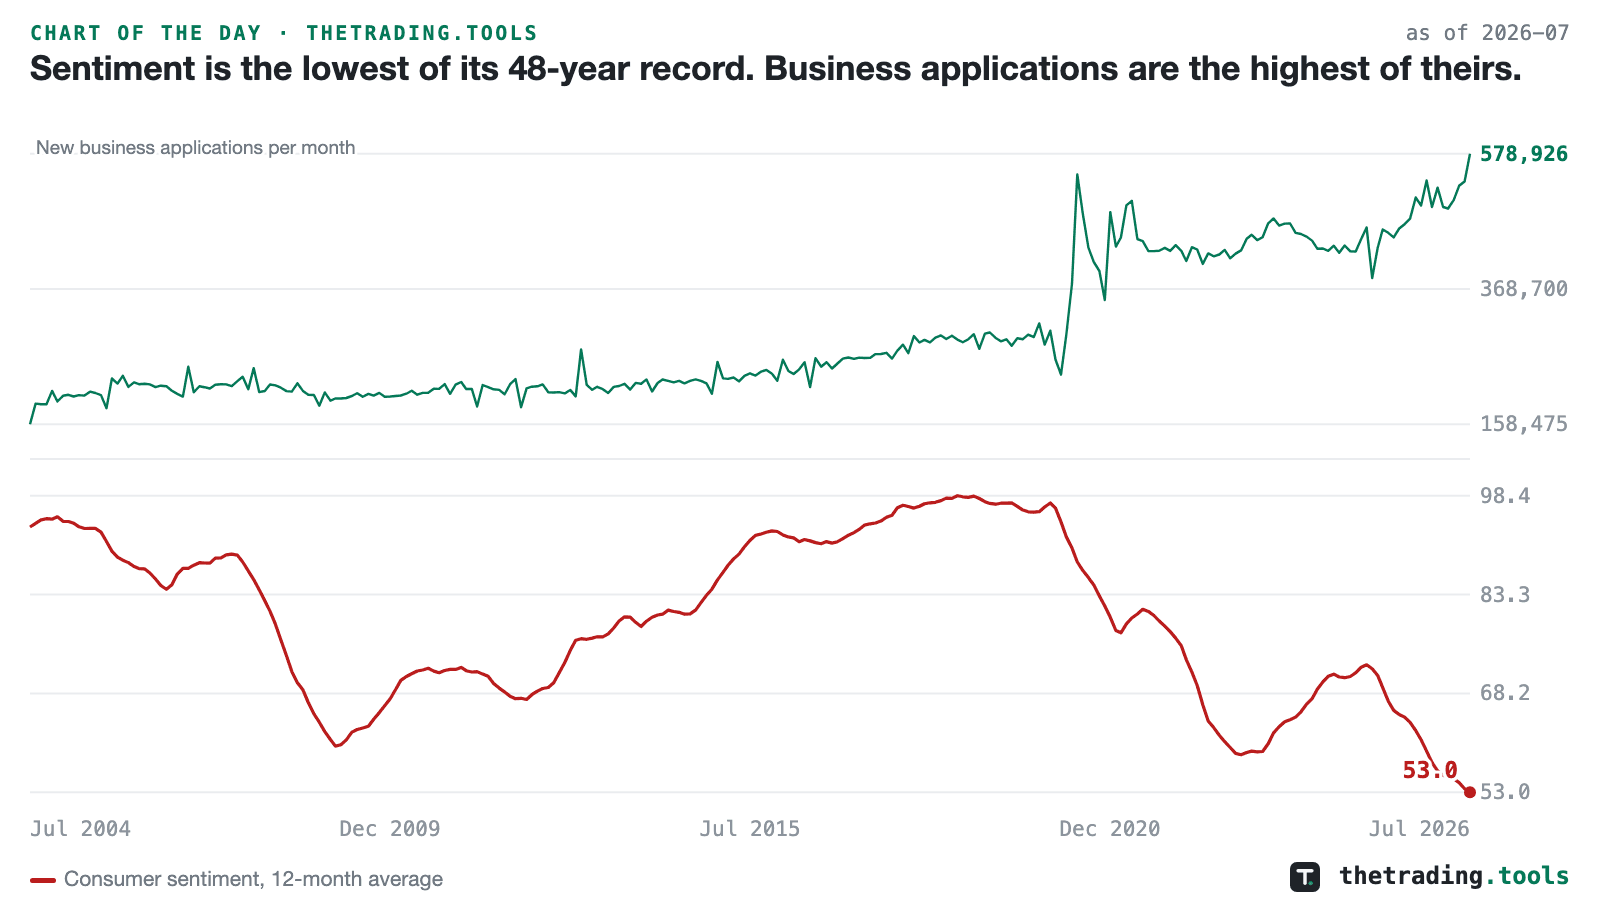
Consumer sentiment’s 12-month average fell to 53.0 in July 2026. That is the lowest reading of the average’s entire record, which begins in December 1978 because the University of Michigan survey ran quarterly before then and a 12-month average needs 12 consecutive monthly readings. The eight lowest readings in that 48-year record are the eight most recent months. The comparison worth having is with the prior troughs: 61.0 in 1980, 60.1 in 2008 and 59.0 in 2022. Today sits below all three.
New business applications reached 578,926 in the same month, a record for a series that starts in July 2004, up 23.4% from a year earlier and close to double the 2019 monthly average of 293,134. Since January 2023 the two series have a correlation of -0.77 across 43 months, so they have been moving in opposite directions for more than three years rather than crossing once. A survey measures how people say they feel and an application is something a person paid to file, which is the reason to weigh the second more heavily. What this page cannot say is why the gap exists, and 43 months is a single episode.
Consumer Sentiment — the live University of Michigan series and its 12-month average
This chart is a frozen capture — the numbers above are as of July 2026 reference month and will not update. The live page recomputes daily from the same dataset. A square version of this chart is available for feeds that crop landscape images.