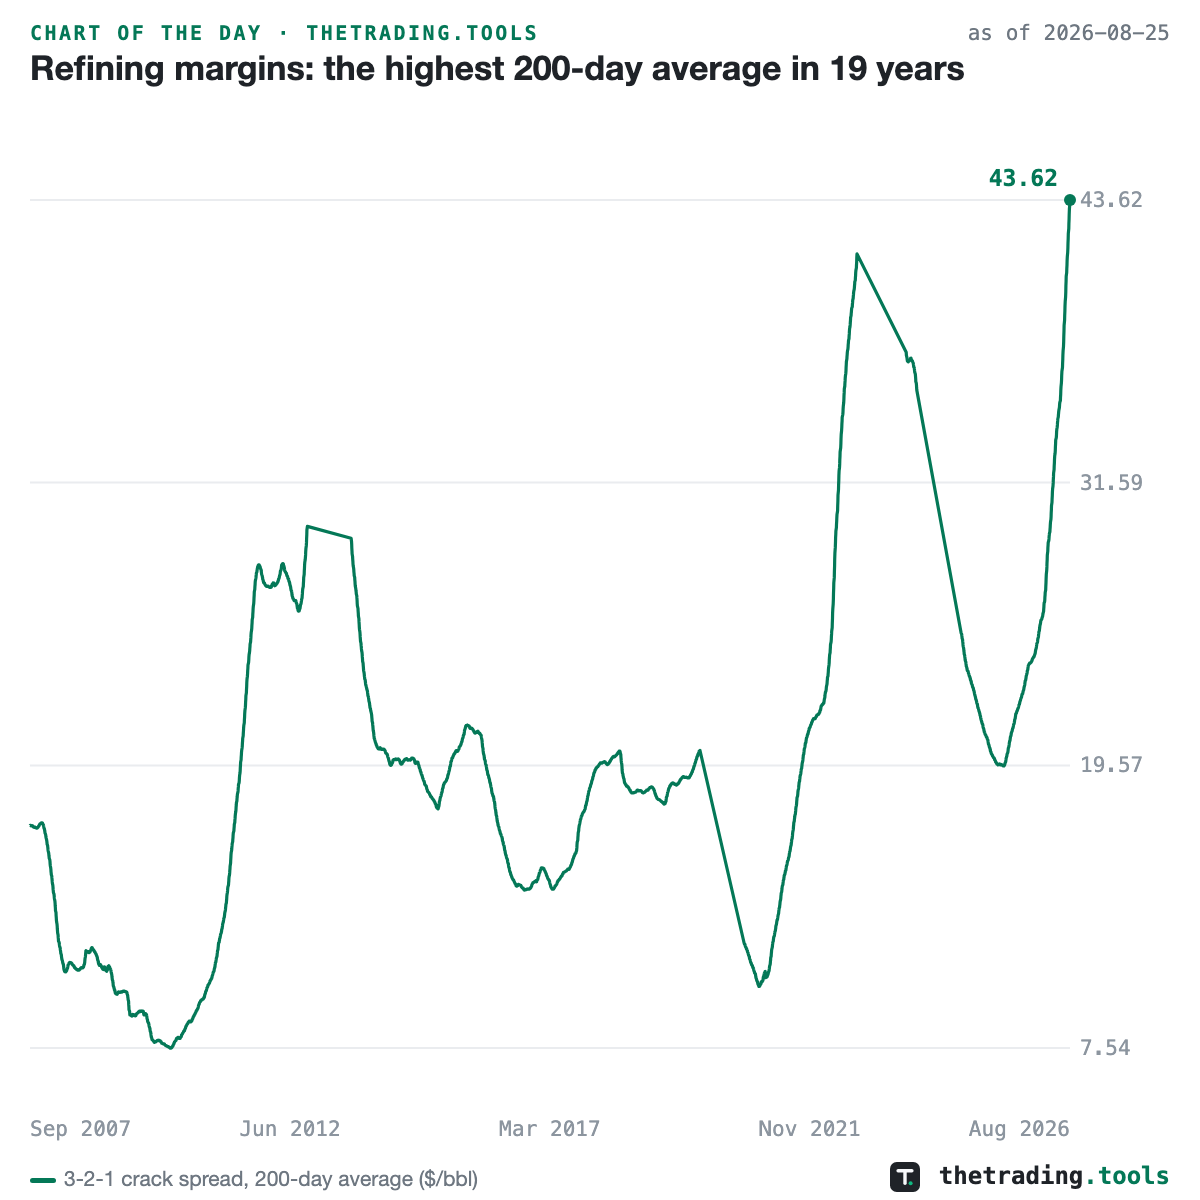
Refining margins have never held this high in 19 years
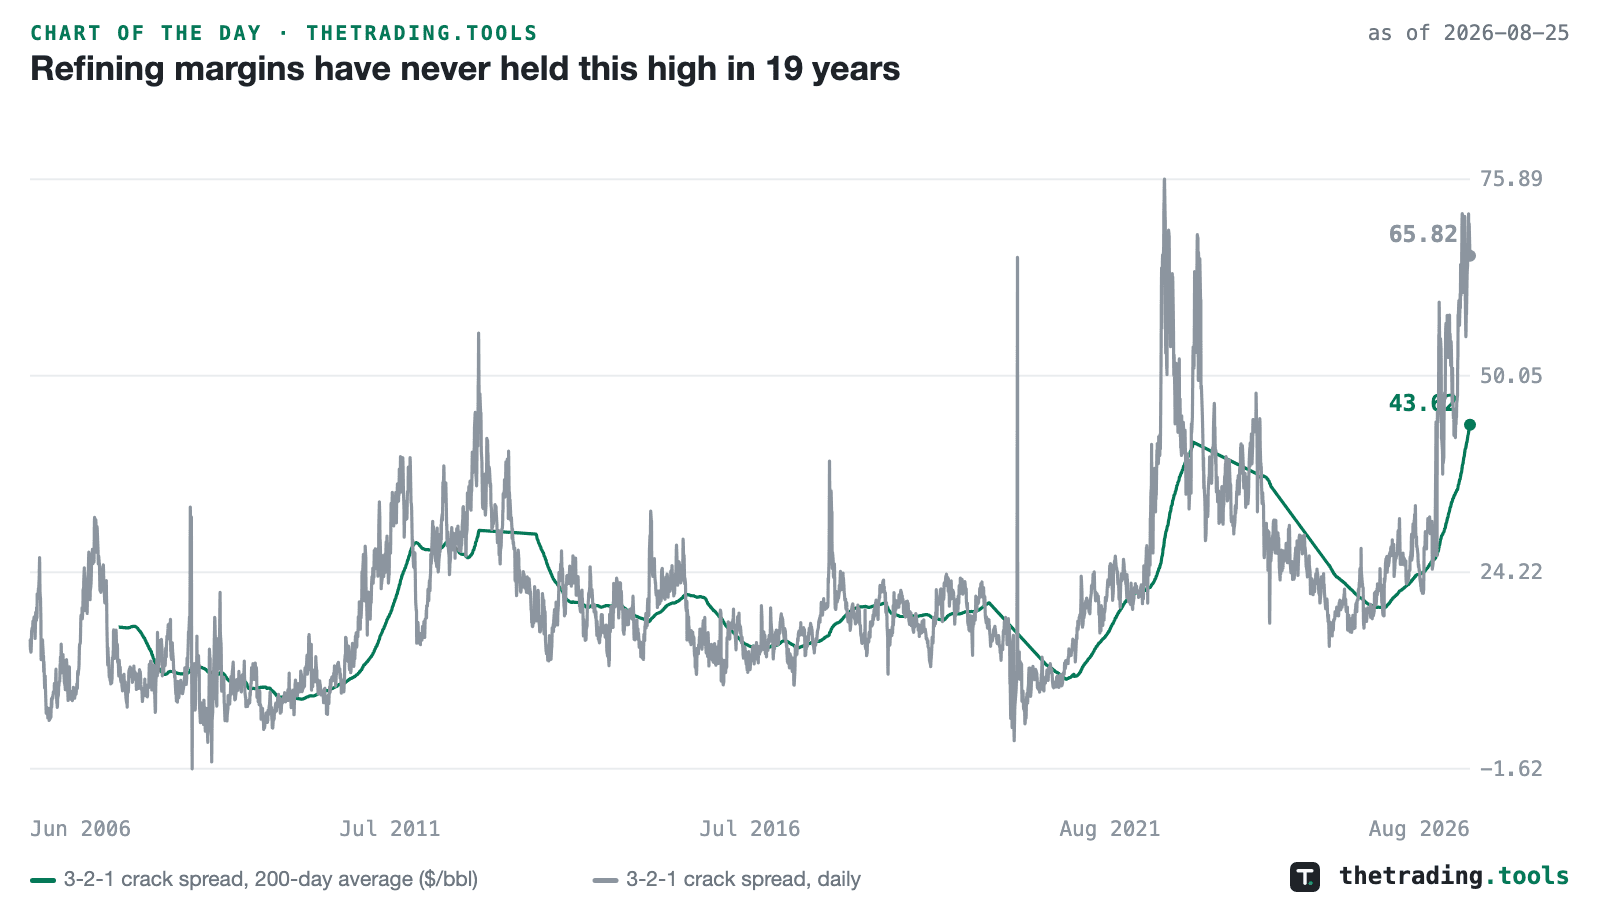
The 3-2-1 crack spread is what a refiner earns turning three barrels of crude into two of gasoline and one of distillate. Its 200-day average reached $43.62 on August 25, 2026, the highest of the 3,934 sessions in that average’s record back to September 2007. The daily spread finished at $65.82. The distinction matters on this chart: the daily spread was higher during 2022, touching $75.89 in May of that year, so the record here belongs to the sustained level rather than to the peak.
A wide crack spread means refined product is scarce relative to crude. That is consistent with the rest of the energy tape in August, where crude fell while retail diesel reached the most expensive reading of its own history. Refiners capture this spread directly, and it lands as a cost on freight, construction and agriculture. Whether it persists depends on refining capacity and maintenance schedules, which this series does not measure.
Crack Spread — the live 3-2-1 refining margin and its 200-day average
This chart is a frozen capture — the numbers above are as of Aug 25, 2026 and will not update. The live page recomputes daily from the same dataset. A square version of this chart is available for feeds that crop landscape images.