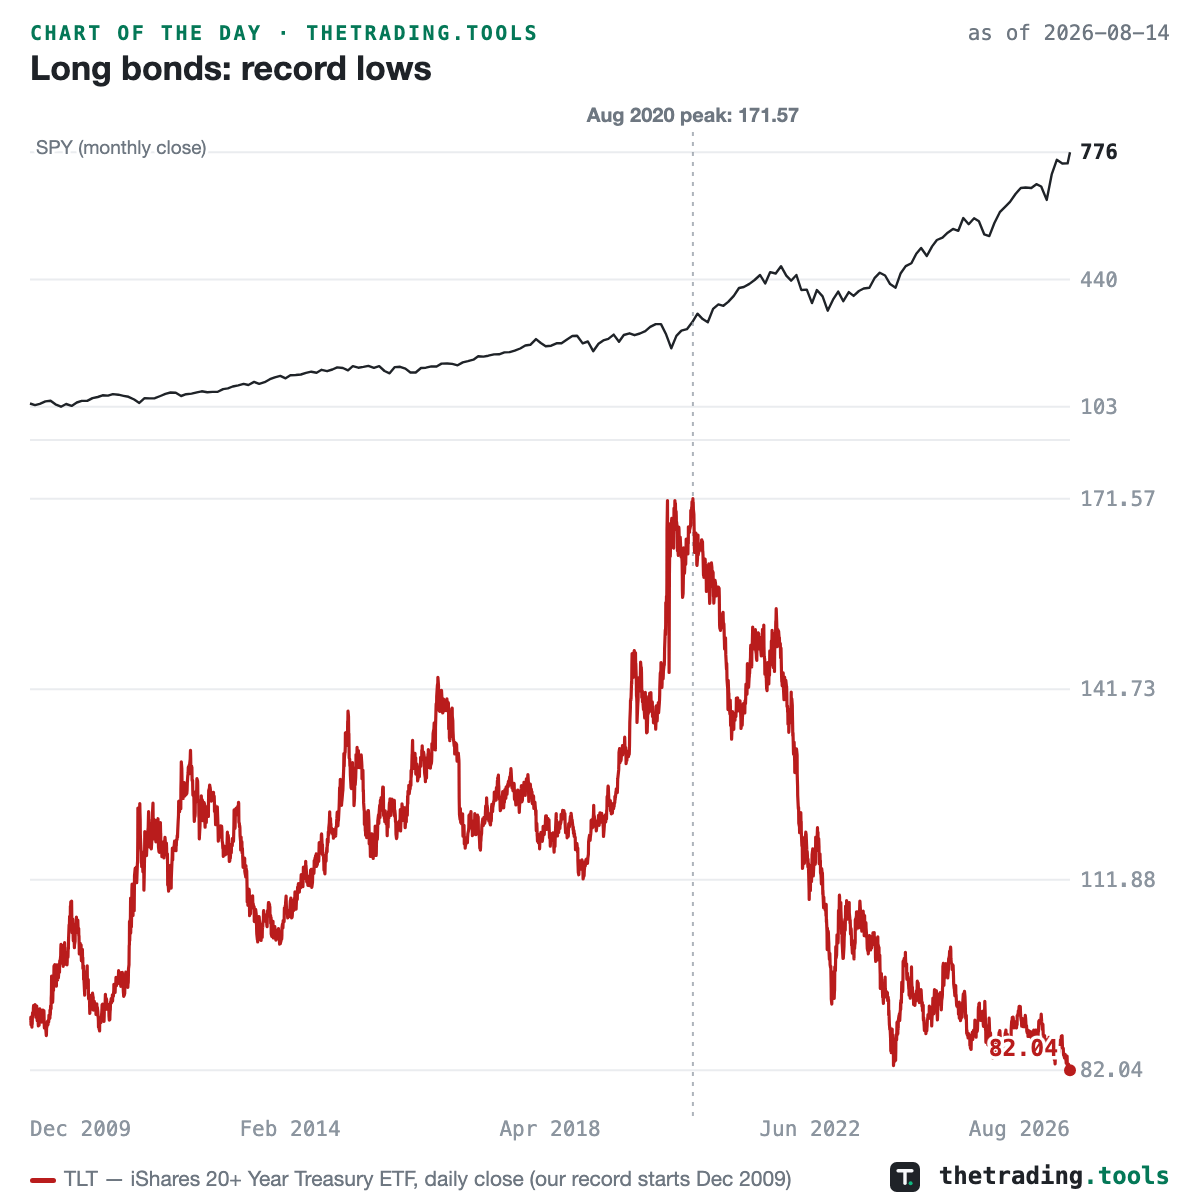
Stocks at record highs, long bonds at record lows
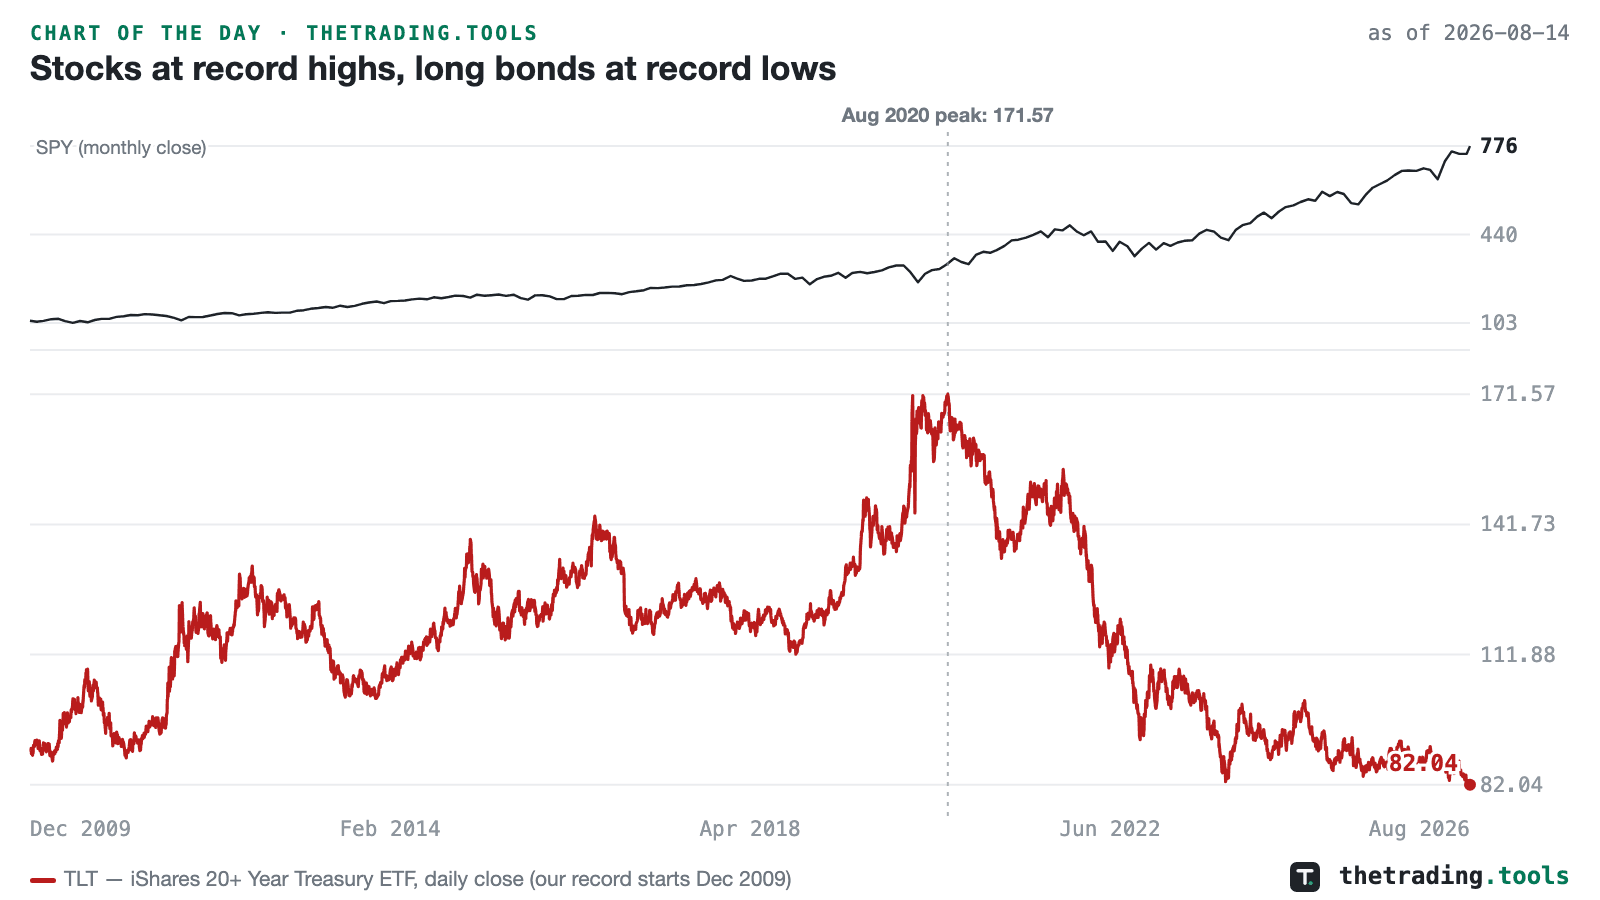
TLT, the 20+ year Treasury ETF, closed at 82.04 on Thursday: the lowest close in our record, which reaches back to December 2009, and its fourth record low in three weeks. It has now lost 52% from the August 2020 peak. The same session, equal-weight RSP, small-cap IWM and industrial XLI closed at record highs, and SPY finished 0.2% below the record close it set a day earlier.
Two scope notes keep this honest: TLT launched in 2002, so earlier lows (the fund traded near these prices in 2004) sit outside our record, and the chart shows price only — holders also collected the fund’s monthly distributions, so total return is far better than the price line. The divergence stands either way: six years of equity records against a halving in long-duration Treasuries.
TLT full daily history on the live chart; yield context at /treasury-yields
This chart is a frozen capture — the numbers above are as of 2026-08-14 and will not update. The live page recomputes daily from the same dataset. A square version of this chart is available for feeds that crop landscape images.