US home values set a record by $50. After inflation they are 7.5% below the 2022 peak
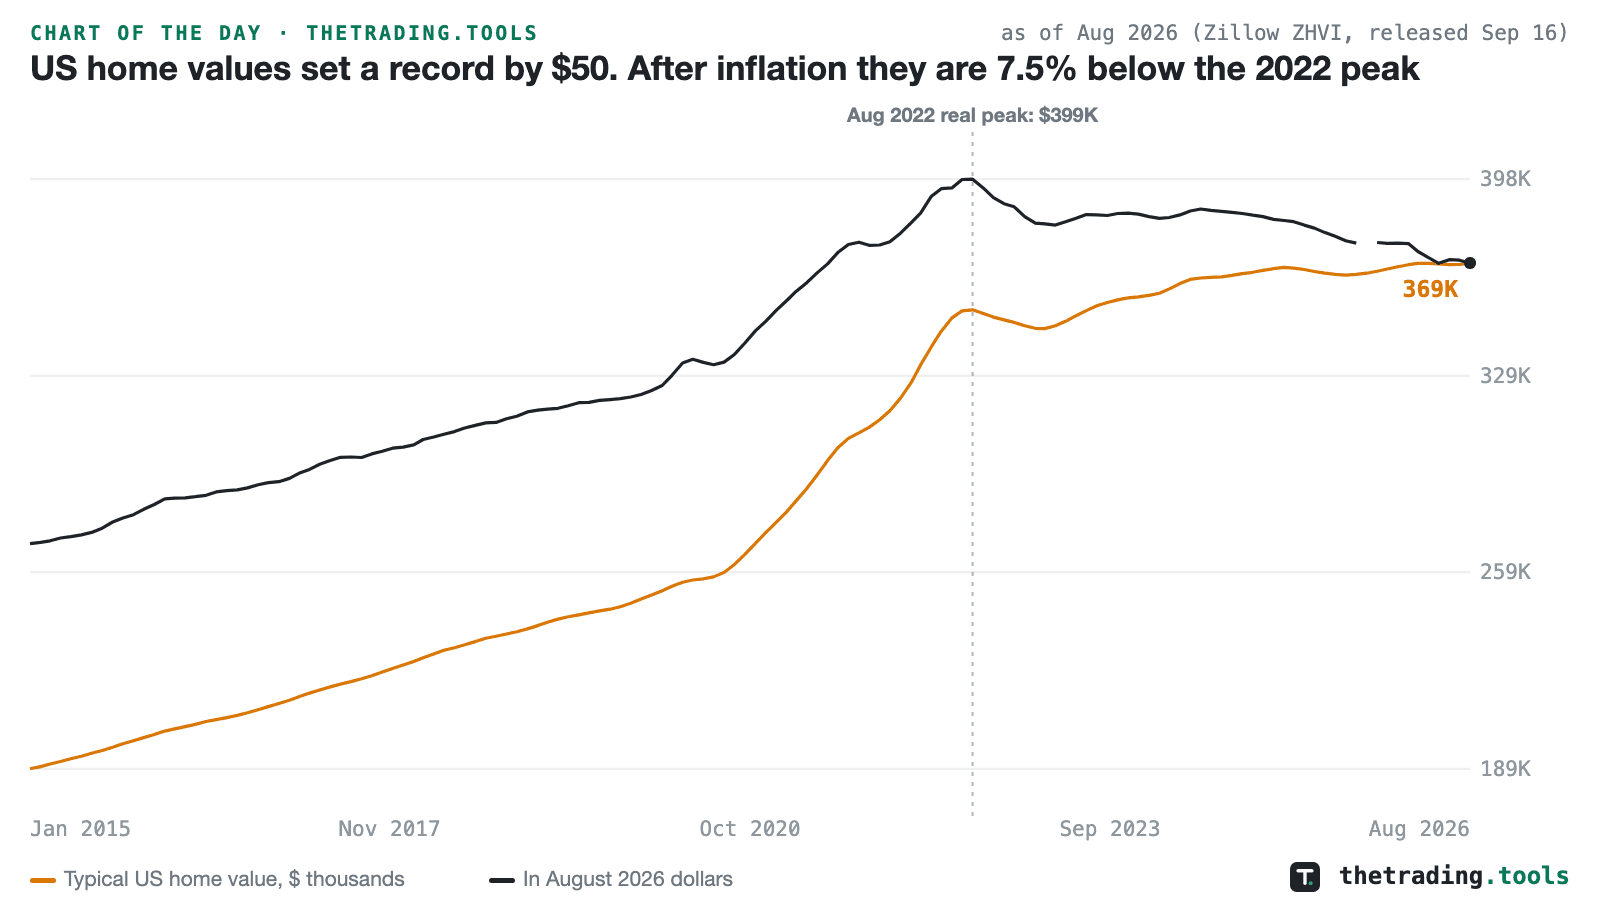
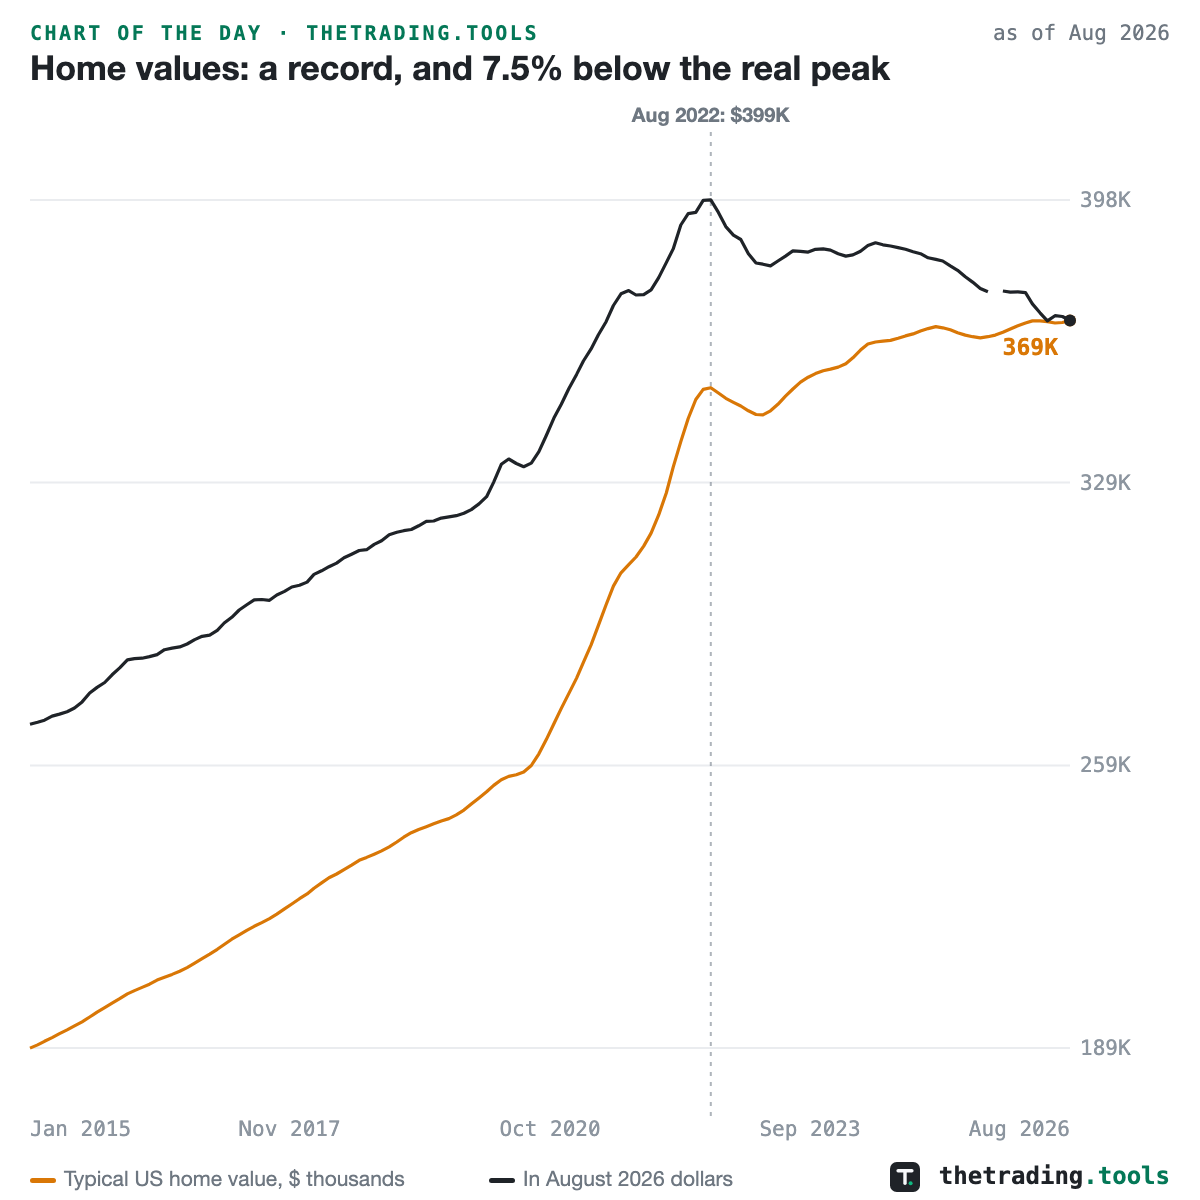
Zillow’s Home Value Index put the typical US home at $368,697 in August 2026, in data released September 16. That is the highest reading in a series that begins in January 2000, and it beat the previous record, $368,647 in April, by $50. In between, the index slipped to $368,142 in June. Over twelve months it is up 1.2%, while consumer prices rose 3.4%. The typical home is worth 46.1% more than in February 2020.
Put the series in today’s dollars and the record disappears. Deflated by the Consumer Price Index, the typical home value peaked in August 2022 at $398,532 in August 2026 dollars, and it now sits 7.5% below that, a difference of $29,835. It is down 2.1% from a year earlier, and it has been below its year-earlier level in all 21 months since November 2024 for which the comparison can be made; October 2025 has no CPI reading, which is the gap in the black line. A flat nominal price under 3% inflation is a slow real decline that never produces a falling headline number. This is a national index of values, which says nothing about any one market, and the chart makes no forecast.
Zillow Home Value Index — the typical US home value since 2000, live
This chart is a frozen capture — the numbers above are as of Aug 2026 (released Sep 16, 2026) and will not update. The live page recomputes daily from the same dataset. A square version of this chart is available for feeds that crop landscape images.