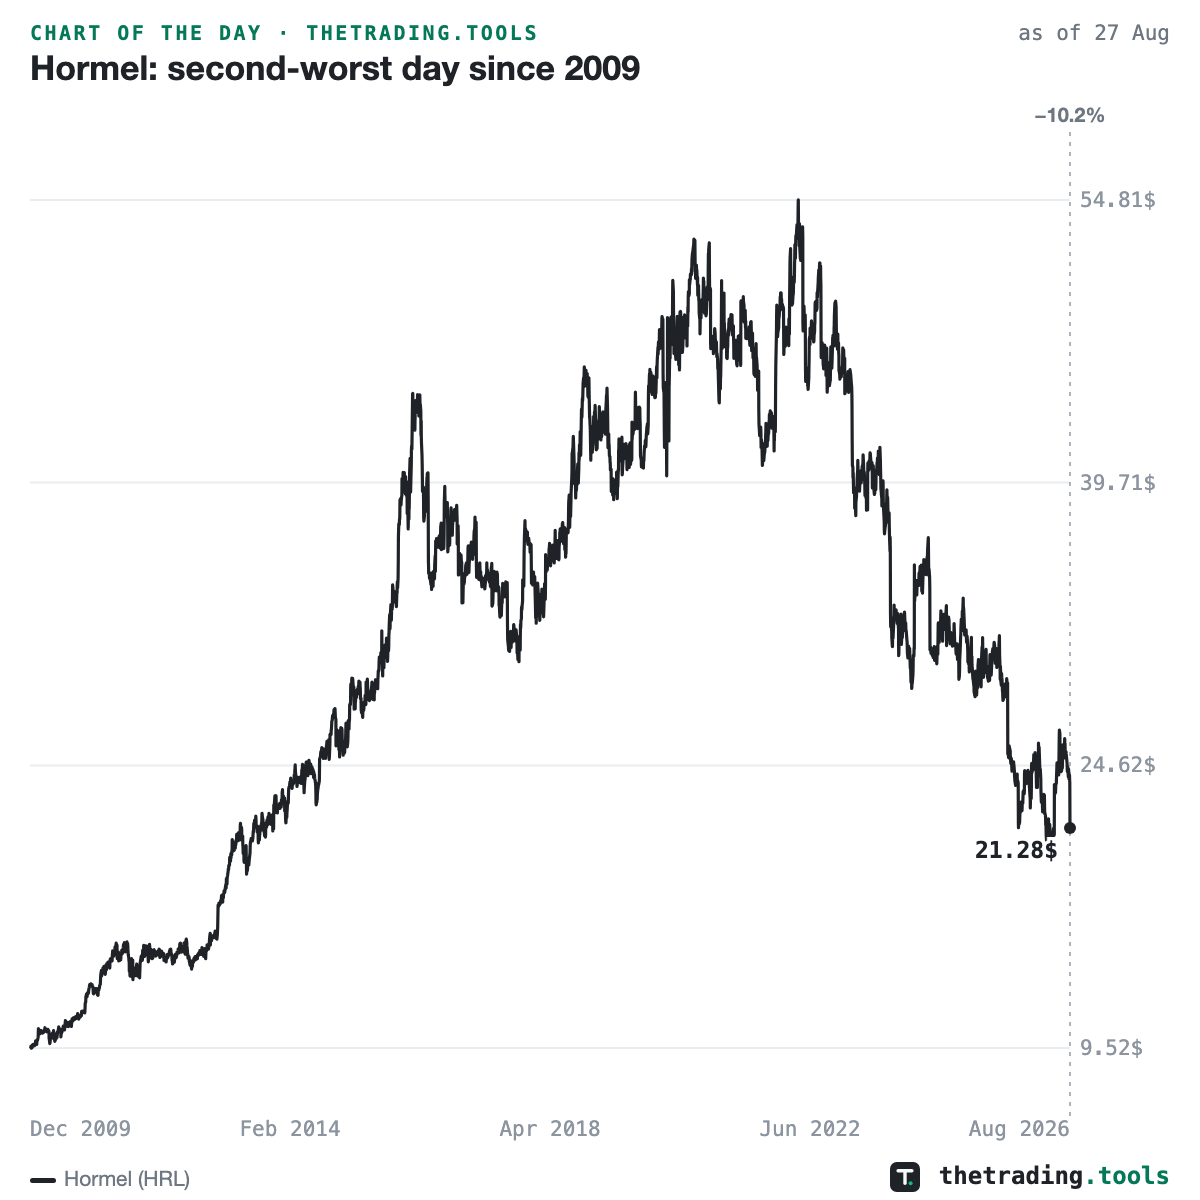
Hormel’s second-worst day since 2009 came a year and a day after its worst
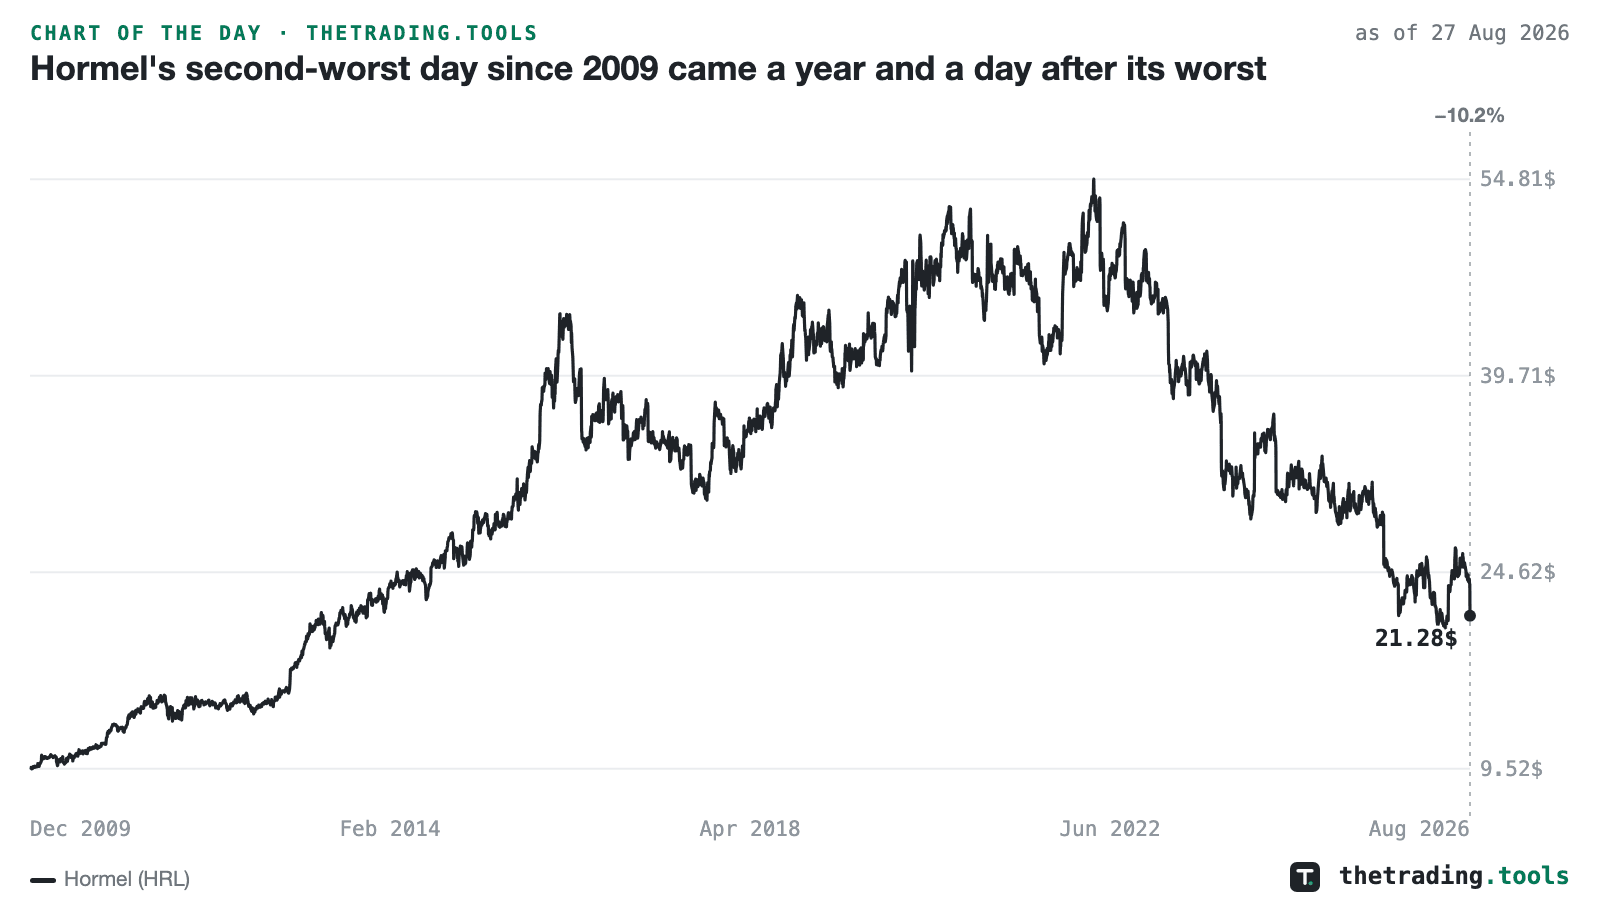
Hormel closed at $21.28 on August 27, 2026, down 10.17%. Measured against the standard deviation of its own trailing year of daily returns, that is a 5.3-sigma session. Our record holds 4,188 trading days back to the end of 2009, and only one of them was worse: August 28, 2025, when the stock fell 13.09%. The two worst sessions in seventeen years landed a year and a day apart, both in the last week of August. Third on the list is October 12, 2023 at −9.83%.
The stock now sits 26.7% below its own trailing-year high. Hormel has traded publicly since long before 2009, so this is the second-worst day in our record rather than in the company’s history — the distinction matters for a name whose listed life runs to the 1920s. Two late-August shocks in consecutive years is a pattern of timing, not yet a statistic; it is the kind of coincidence that is worth noticing and not worth trading on its own.
Unusual Volume — the session’s abnormal-volume flags with verified catalysts
This chart is a frozen capture — the numbers above are as of Aug 27, 2026 close and will not update. The live page recomputes daily from the same dataset. A square version of this chart is available for feeds that crop landscape images.