thetrading.tools

Insights

The data has opinions.

Essays built on the same daily-updated datasets that power our tools — every chart live, every claim checkable, every piece answering a question traders actually ask.

New research now ships first as the Research Letter on Substack — same data, same standards, straight to your inbox. What subscribers get →

RSS feed for these studies →
July 14, 20269 min read

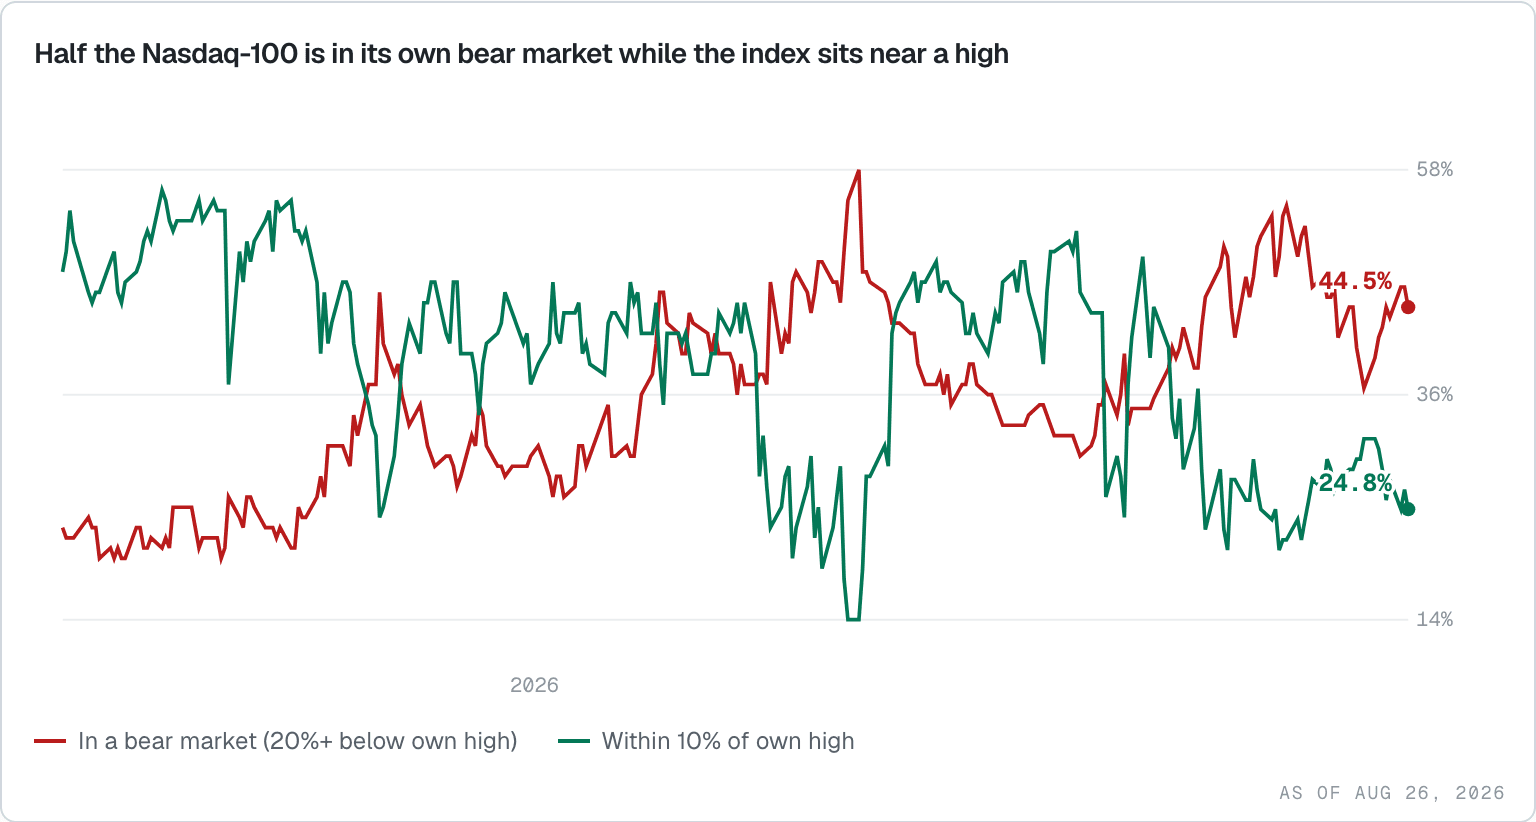
Nearly Half of Nasdaq-100 Stocks Are in a Bear Market. The Index Is 3% From a Record

The scary chart is real: 45 of the Nasdaq-100’s members are in their own bear markets while the index trades within 3.5% of its all-time high. The instinct is to call that a crack in the foundation. Our own base rates say the opposite — high bear-share readings have historically resolved up, not down — but nearly every one of those precedents came from washouts, when the index was falling too. Today’s shape, half the membership broken with the index at highs, has almost no history at all. That is the actual story, and it cuts both ways.

Read the analysis
July 3, 20269 min read

Why Are Tech Stocks So Volatile Right Now? The Tech-Vol Spread Is the Widest Since 2003

Tech traders have felt it for weeks: the Nasdaq is swinging harder than the tape. It isn’t a feeling — QQQ’s realized volatility is running 16 points above SPY’s, a 94th-percentile gap, and the options market has repriced it as a regime: the VXN−VIX implied-vol spread just hit 11 points, a level every prior instance of which came from one era — the dot-com unwind of 2001–2003. The strange part is what isn’t moving: VIX sits at a sleepy 16.6. The market isn’t scared; tech specifically is. We walk through what the spread measures, why 2008 and 2020 sent it negative instead, and what the top-quintile readings historically meant for QQQ over the next one to three months.

Read the analysis
June 25, 202610 min read

Is the Fed Cornered? Inflation Hit 4.1% — and the Chair Trump Hired to Cut Is Signaling Hikes

The awkward part is simple: Trump wanted rate cuts, and the inflation math is moving the other way. Headline PCE just hit 4.1%, the hottest since 2023, and with the funds rate at 3.63% the real policy rate — the funds rate after inflation — has gone negative. There is no cushion left to cut from, which is why the chair Trump appointed in May to ease is now, a month later, watching his own committee pencil in hikes. So is the Fed cornered? On the headline number, yes — but 4.1% overstates the trap. The spike is energy and tariffs, core PCE is a calmer 3.4%, and the bond market still prices long-run inflation near 2.2%. The real bind turns out to be political, not monetary.

Read the analysis
June 20, 20269 min read

Is the US Consumer Healthy? Sentiment Just Hit a Record Low — and Spending Keeps Rising

Consumer sentiment just printed the lowest reading in the survey’s 74-year history, and the OECD confidence gauge is at a record low too. By the vibes, the US consumer is in a depression. By the receipts — real spending up 2.1% over the past year, real retail sales up 2.4%, credit-card delinquencies falling for seven straight quarters, continued claims improving — the consumer is still expanding. The caveat is real: wages are trailing the latest CPI print, and the 2.6% saving rate leaves little room for an income shock.

Read the analysis
June 18, 20269 min read

There’s $8 Trillion Sitting in Money Market Funds. Will It Flow Into Stocks?

A record pile of cash — $8.3 trillion in money market funds, $2.25 trillion of it held by retail investors — has the bulls calling for the next leg up the moment it "rotates back in." The plumbing says cash doesn’t flow into the market in aggregate. Our own data says something more useful: across six Fed easing cycles since 1993, the cash only fueled stocks when the economy avoided recession. The pile isn’t the signal; the regime is.

Read the analysis
June 15, 20268 min read

Hedge Funds Are Record-Short S&P 500 Futures. Why It Isn’t Bearish

Leveraged funds are more net-short E-mini S&P 500 futures than at any point in three years, and the COT crowd-following crowd reads that as smart money bracing for a fall. Our own data says the opposite: over five years, the most-short readings preceded the weakest forward returns, not the strongest. The reason is the cash-futures basis trade — a financing position, not a directional bet — and once you see it, the whole "fade the funds" framing falls apart.

Read the analysis
June 12, 20269 min read

Household Equity Allocation Hit a Record. What It Means for Future Stock Returns

American households have never held this much of their wealth in stocks — more than at the 2000 peak, more than 2007, more than 2021. The bears read it as complacency. The full story is more interesting: a structural shift in how America buys stocks broke the old comparison, the predictive power survives anyway, and the series just did something it has only done at major tops.

Read the analysis
June 12, 20269 min read

Is Inflation Coming Back? The PPI–CPI Gap Just Hit Its 97th Percentile

Consumer inflation went from 2.4% to 4.2% in four months. Producer prices went from 3.2% to 13.1%. The gap between them — 8.9 points — has been wider in only 26 of the last 940 months, and every prior episode resolved in one of three ways. We walk through all five episodes since 1948, what each did to consumer prices, and which one this looks like.

Read the analysis