The three weakest-breadth record highs since 1960: 1972, 2000 and now
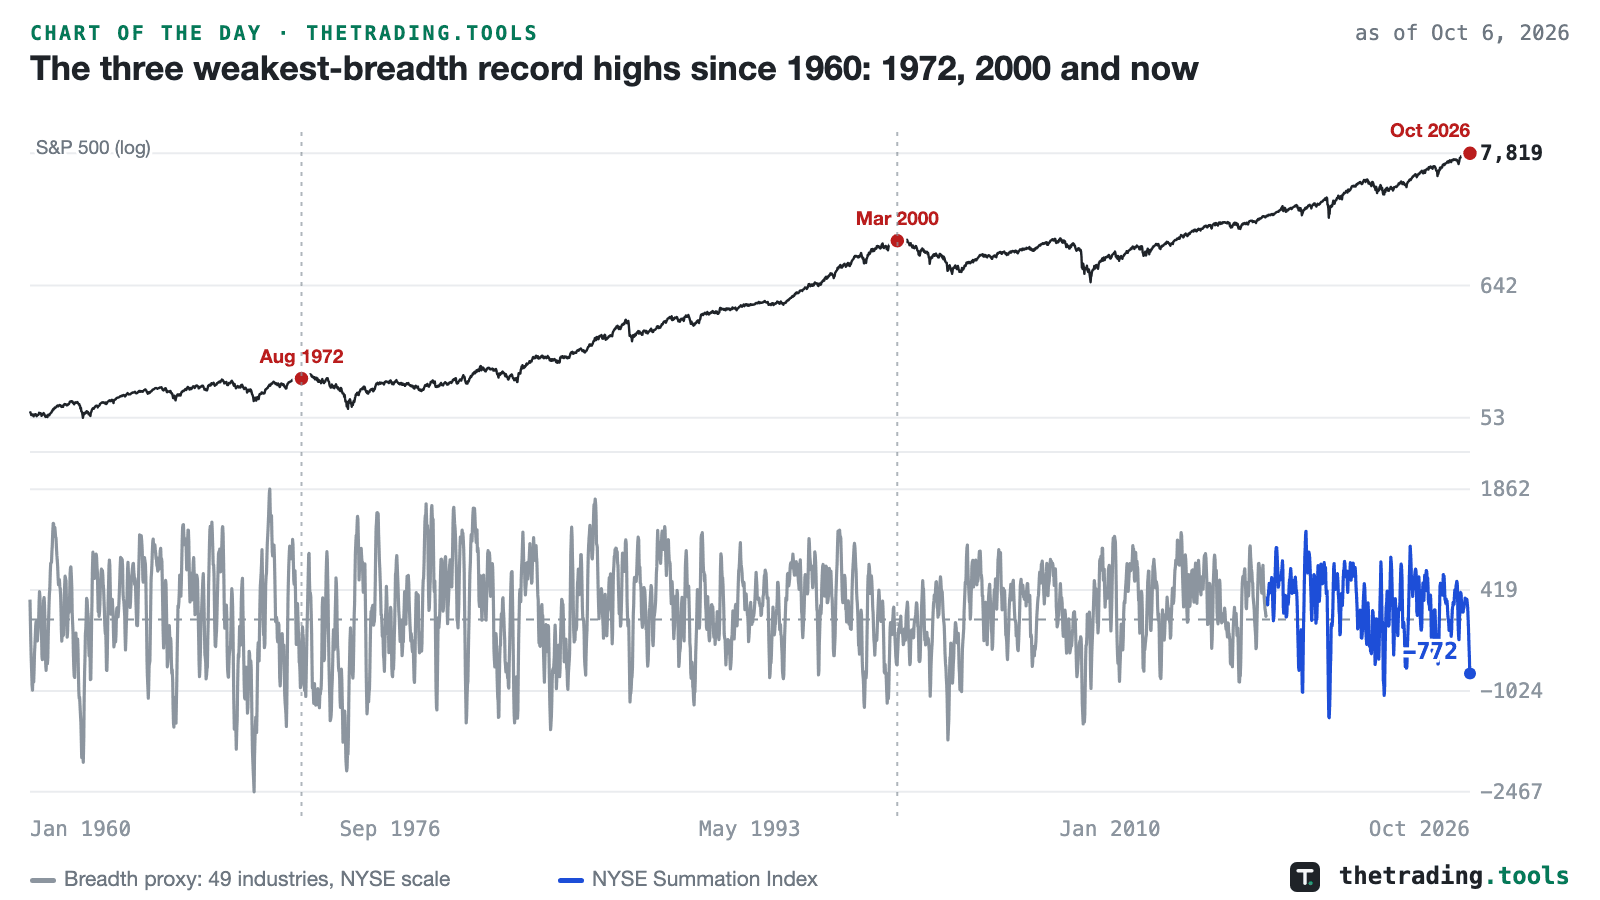
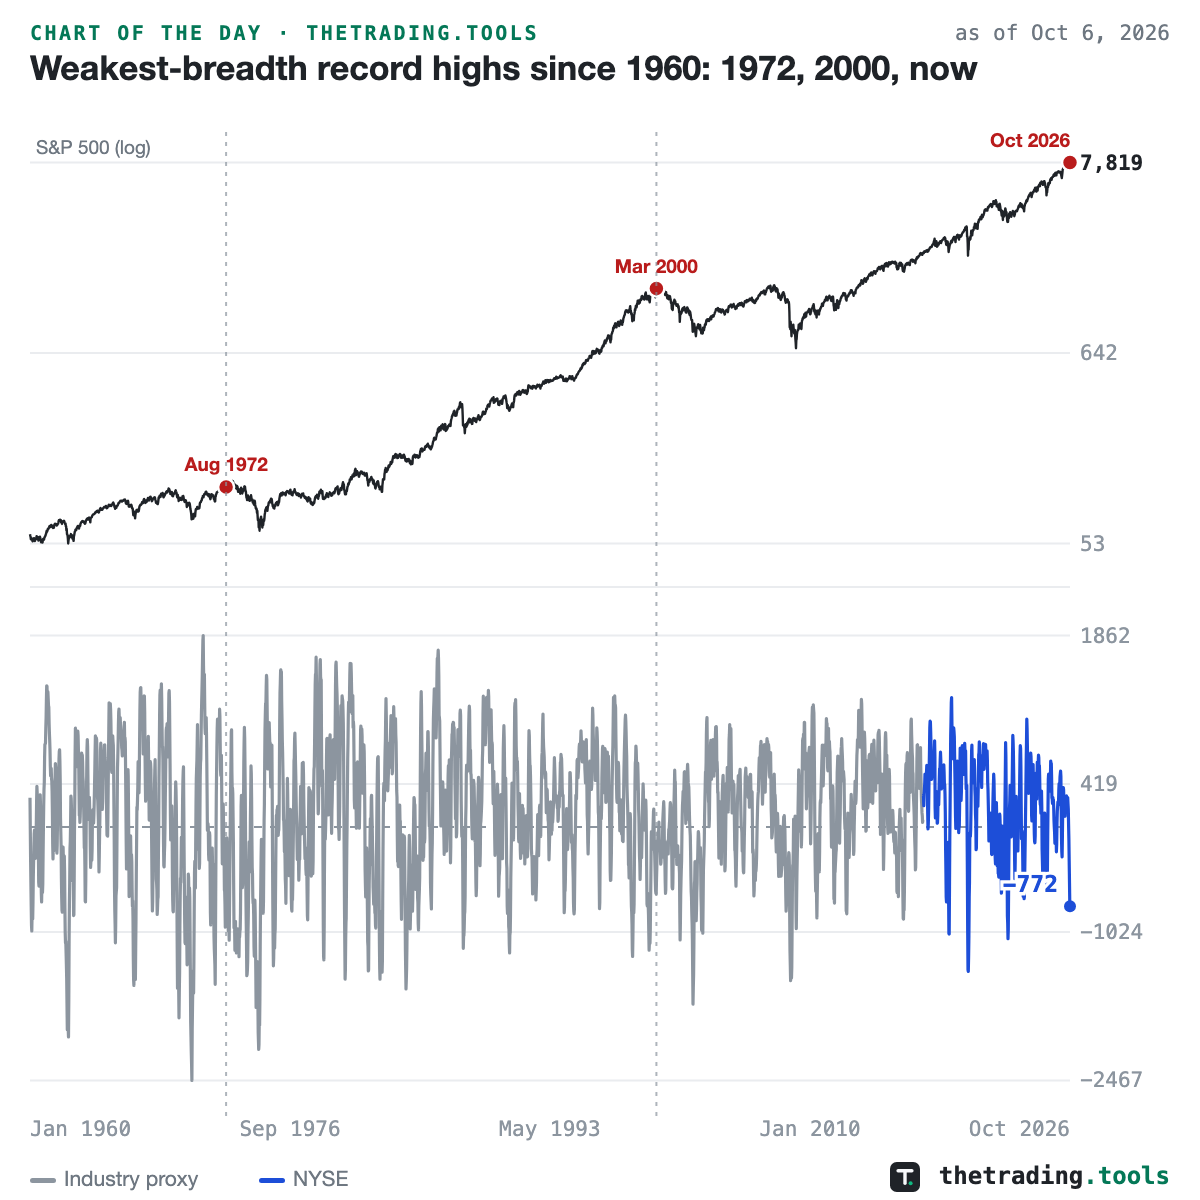
SPY closed at $779.09 on October 6, 2026, a record, above its August 13 close of $777.88. On the same day the ratio-adjusted McClellan Summation Index for NYSE common stocks stood at −772. The index adds up the McClellan Oscillator, the gap between a fast and a slow average of the day’s advances minus declines, so it falls when more stocks decline than advance for weeks at a time. Of SPY’s 326 record closes since April 2017, October 6 is the only one with the index below −700, and the weakest before it was −310 on December 27, 2021.
Our NYSE record begins in 2016. Before that, the gray line applies the same calculation to Ken French’s 49 US industry portfolios, counting how many rose and fell each day, converted to the NYSE scale; it tracks the NYSE line at a correlation of 0.93 since 2017. Taking one reading per year, the weakest breadth at any S&P 500 record close since 1960 is October 2026 at −772, then August 1972 at −749 and March 2000 at −612. A year after the 1972 record the index was down 5.3%, and within three years it had fallen as much as 43.7%. After March 2000 it was down 24.9% a year later and as much as 48.0% within three years. Two earlier cases are too few for a rate, an industry count only approximates a stock count, and the chart makes no forecast. The live page charts the NYSE index as a running total from its 2016 start, which sits a fixed distance below this line and has the same shape.
McClellan Oscillator and Summation Index — NYSE, S&P 500 and Nasdaq breadth, live
This chart is a frozen capture — the numbers above are as of Oct 6, 2026 close and will not update. The live page recomputes daily from the same dataset. A square version of this chart is available for feeds that crop landscape images.