Shiller CAPE at 41.2 — highest since September 2000
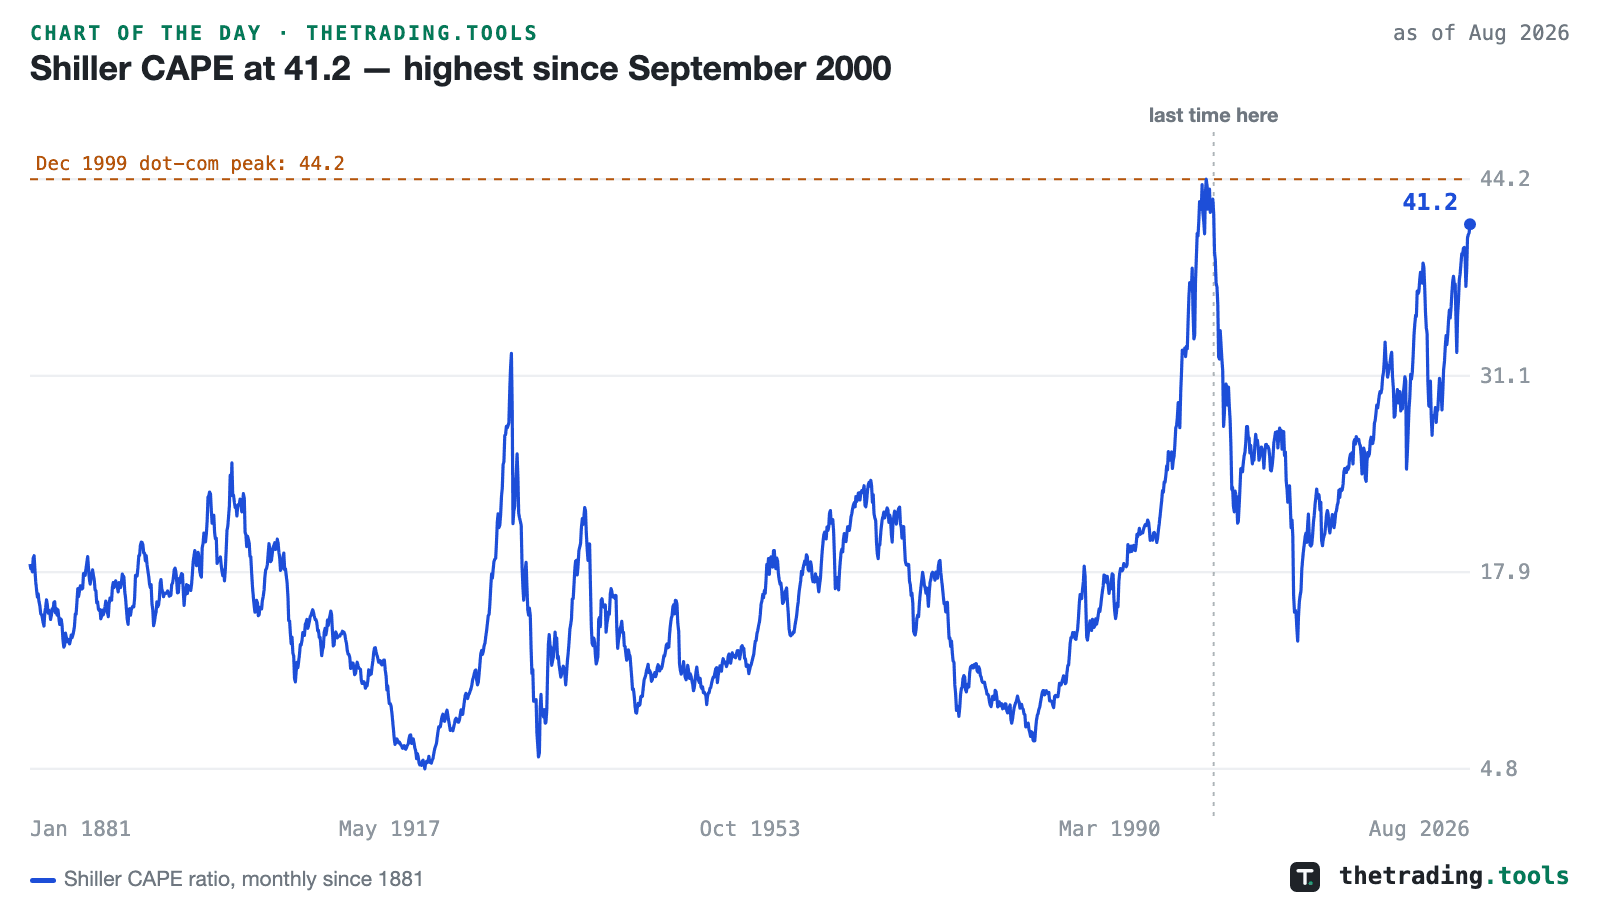
The Shiller CAPE ratio — price over the 10-year average of inflation-adjusted earnings — reached 41.2 in August 2026. The last month at or above this level was September 2000. In 145 years of monthly data, only the dot-com peak months rank higher, topping out at 44.2 in December 1999.
CAPE works on a decade horizon rather than as a sell signal: the current 30+ episode is already the longest on record at 79 months and counting, and high readings historically compressed forward 10-year real returns instead of scheduling a crash.
Open the live version →
Shiller CAPE — live gauge, and what followed past readings above 30
This chart is a frozen capture — the numbers above are as of Aug 2026 and will not update. The live page recomputes daily from the same dataset.