The Sahm rule has fully unwound
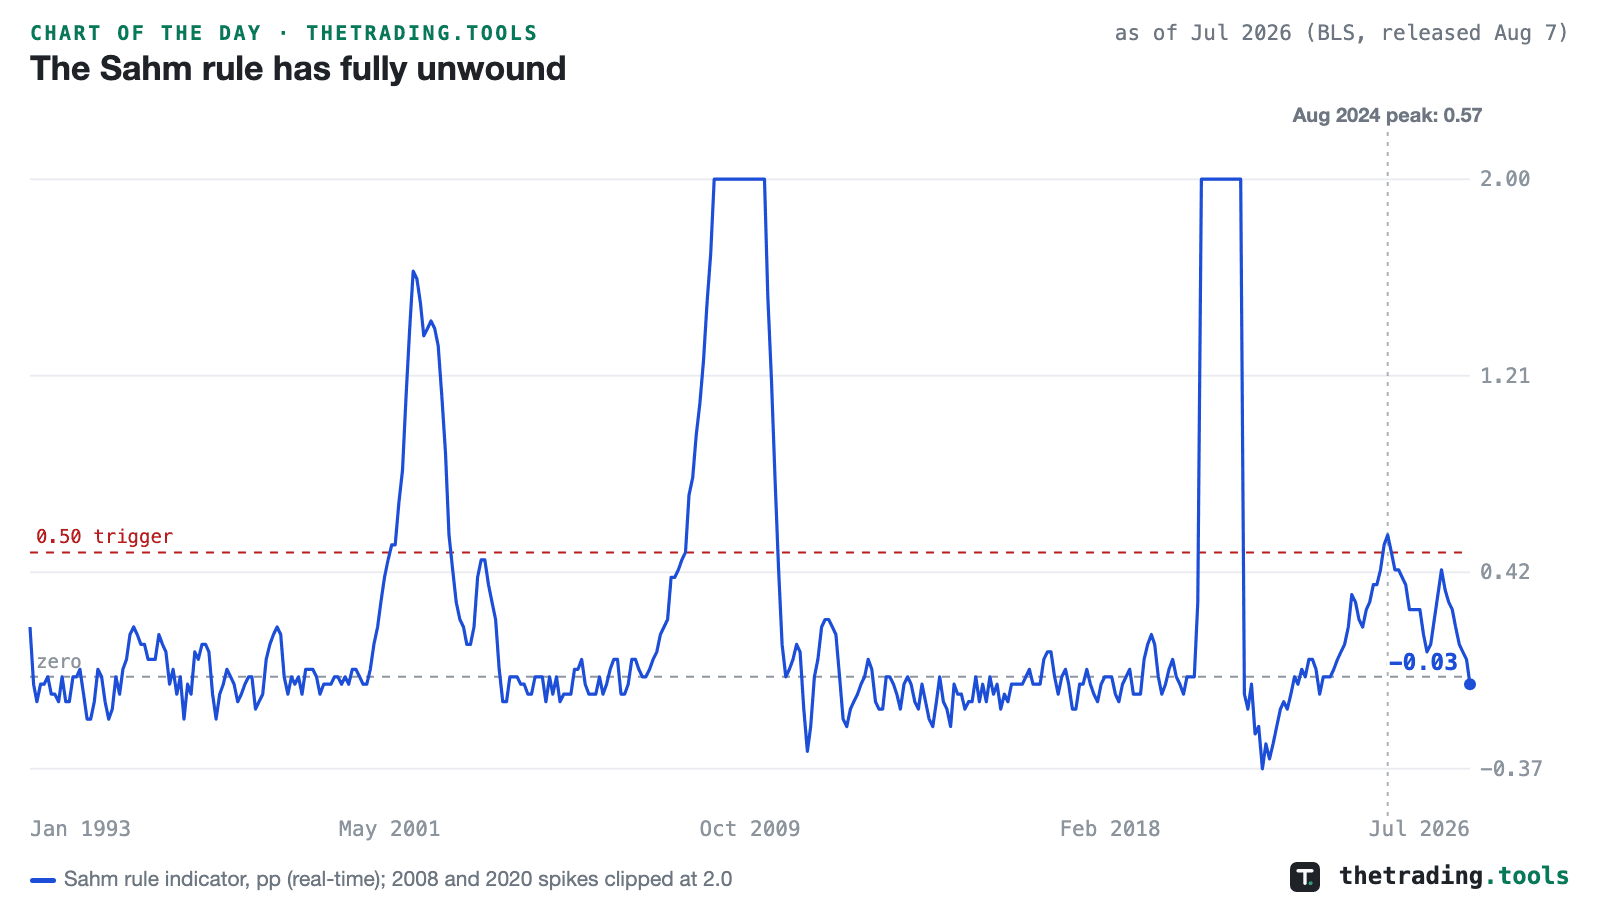
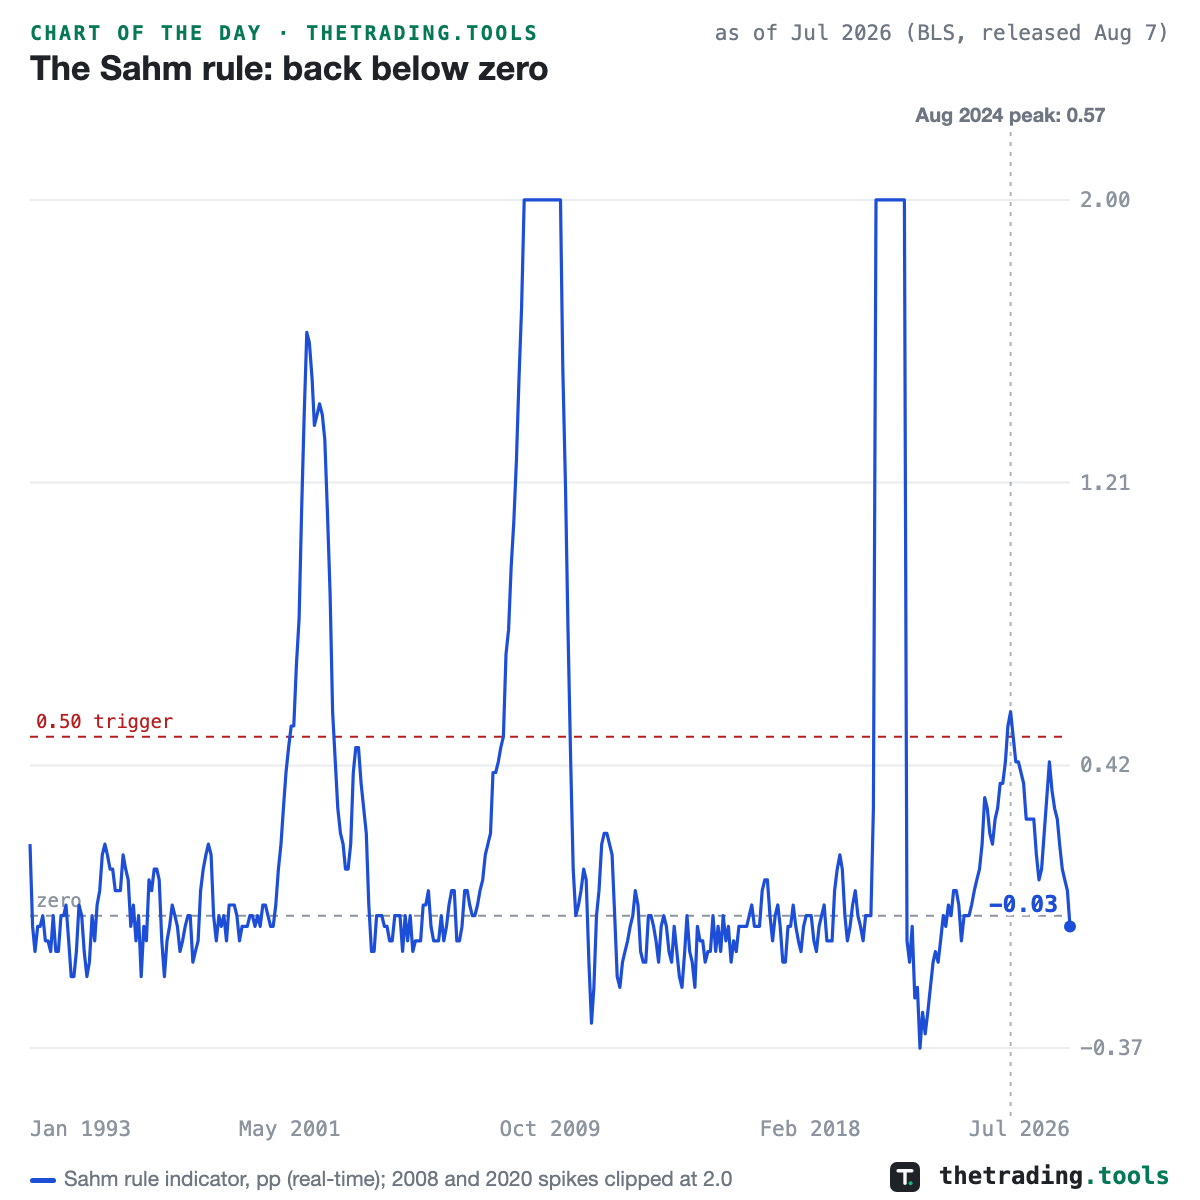
The real-time Sahm rule indicator printed −0.03 for July, its first negative reading since January 2023. It crossed the 0.50 trigger at 0.53 in July 2024 and peaked at 0.57 that August, the threshold Claudia Sahm designed to flag every US recession since 1970. A negative reading means the three-month average unemployment rate now sits below its low of the prior 12 months.
The 2024 signal joined the short list of false positives, and Sahm herself said in 2024 that a labor-supply surge could distort it. The chart clips the 2008 and 2020 spikes at 2.0 so the trigger zone stays readable; the 2020 peak was 9.5. This says something about the last cycle, and nothing about when the next one starts.
Sahm Rule Recession Indicator — full history, release dates and the recession record
This chart is a frozen capture — the numbers above are as of Jul 2026 (BLS via FRED, released Aug 7) and will not update. The live page recomputes daily from the same dataset. A square version of this chart is available for feeds that crop landscape images.