A quarter of S&P 500 stocks now move against the index
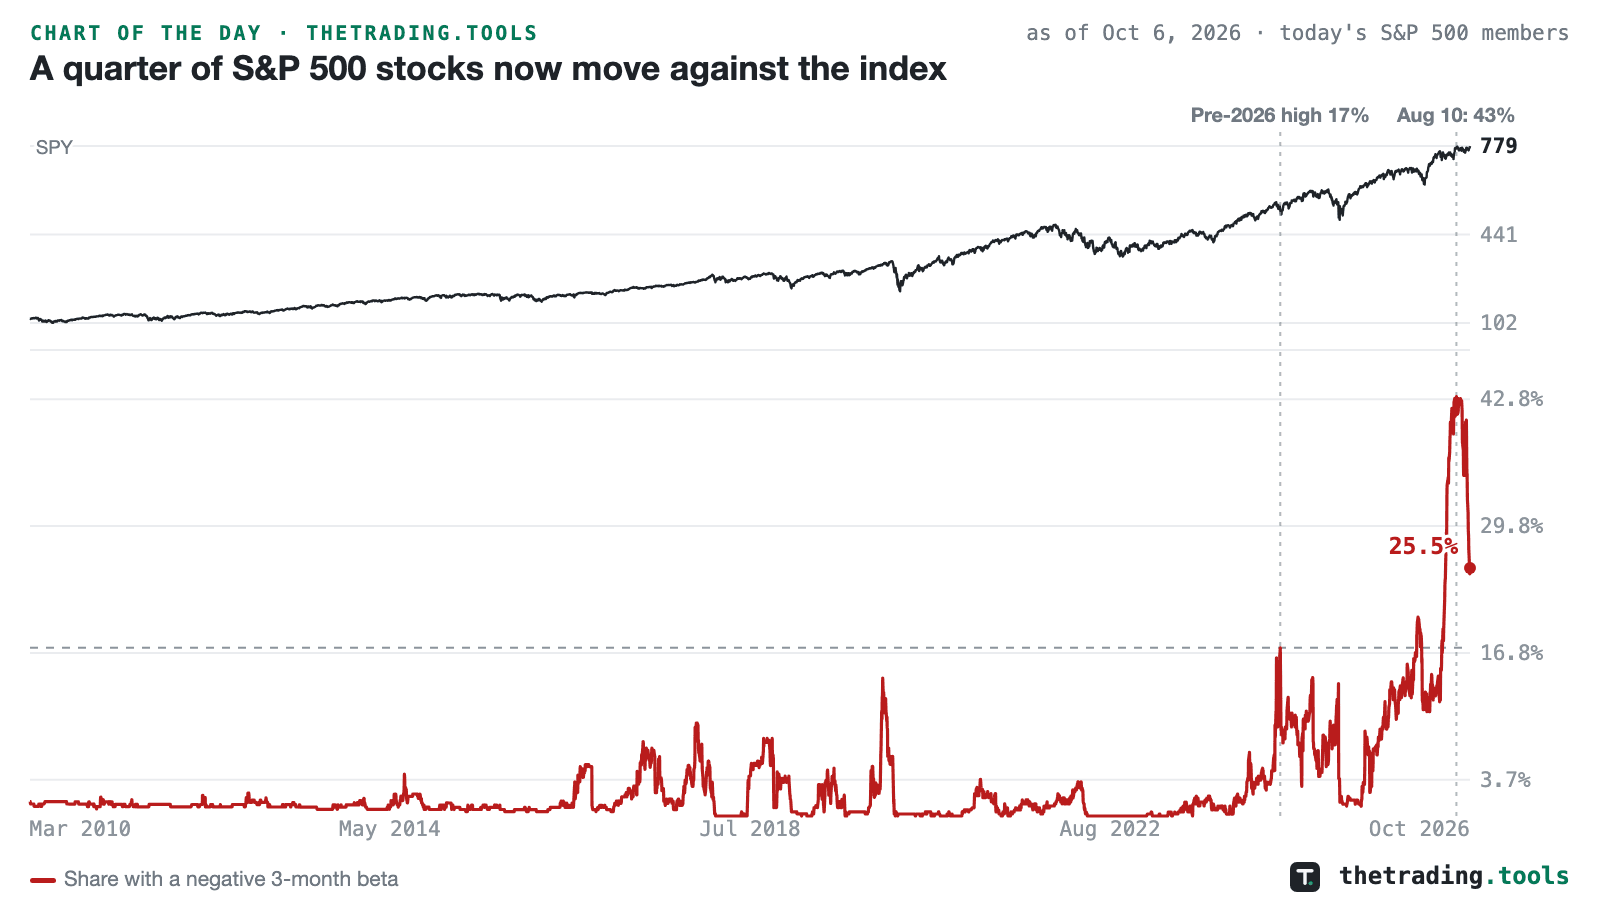
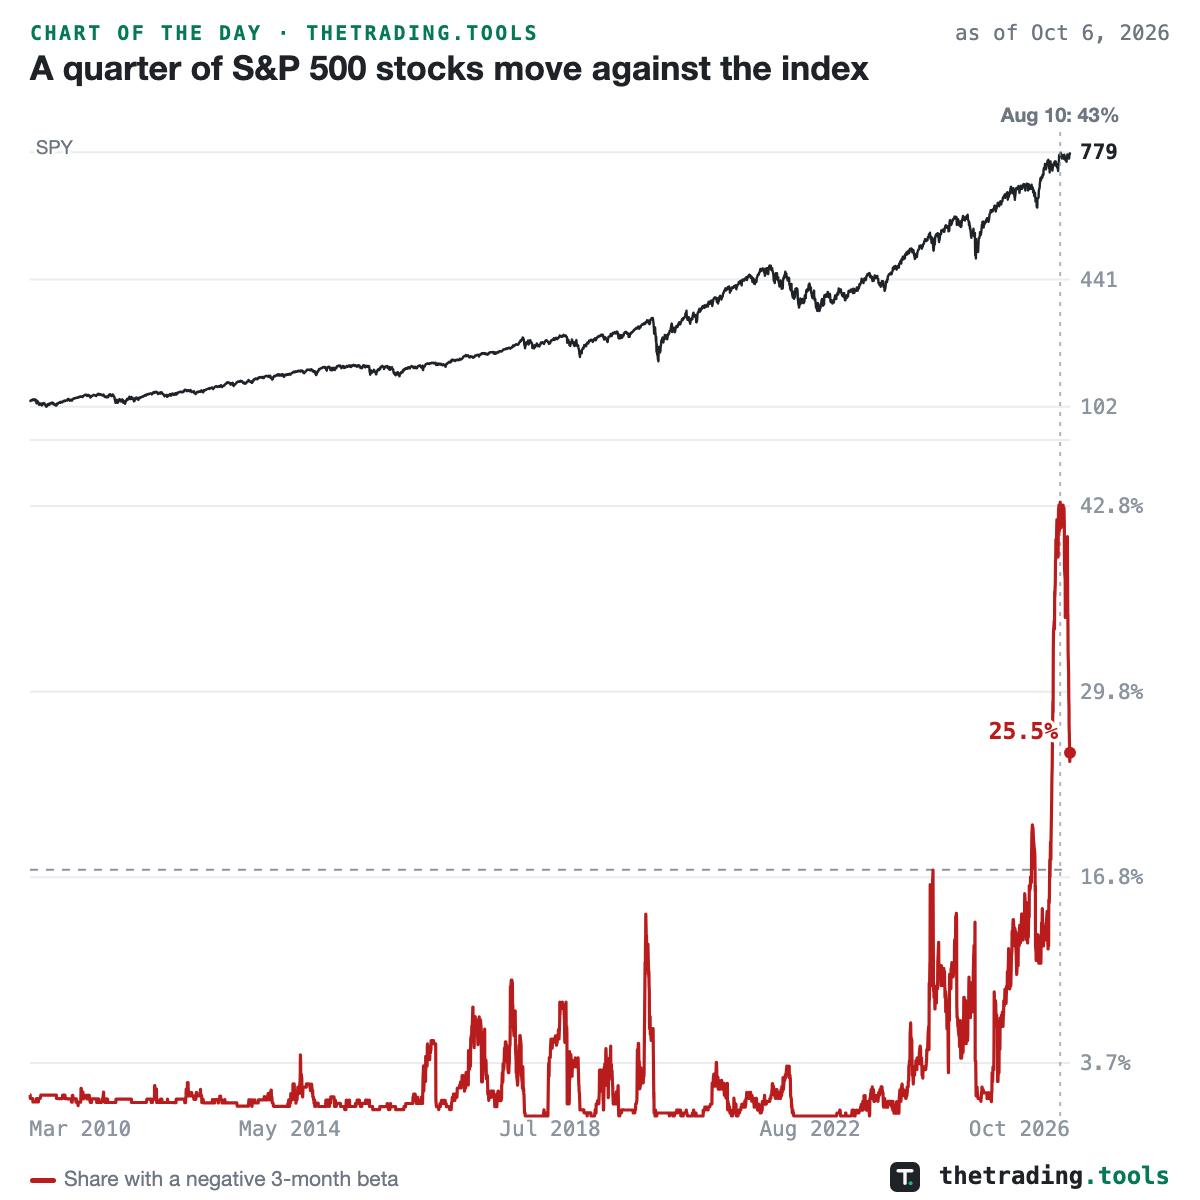
On October 6, 2026, 25.5% of the 494 S&P 500 members in our data had a negative beta to the index over the last three months: they tended to rise on SPY’s down days and fall on its up days. The median since 2010 is 1.2%, and before 2026 the high was 17.3% in August 2024. The share peaked at 43.1% on August 10 and has fallen since, but it is still above any reading before this year. The slower one-year measure, built on weekly returns, is 18.7%, against a record of 18.9% set in July.
The split is concentrated: 16 of 20 energy stocks have a negative beta. A negative beta is about direction from day to day and does not mean a stock is falling. Over the same three months the median negative-beta member returned −3.0% and the median positive-beta member −2.8%, while SPY rose 4.5%. The same measure on 49 US industries since 1926, which has no survivorship gap, reached 28.6% in July 2026, above its previous high of 18.4% in February 2001. The member series uses today’s index list, so it describes the market and supports no forecast.
Negative Beta Tracker — the share of S&P 500 stocks moving against the index, live
This chart is a frozen capture — the numbers above are as of Oct 6, 2026 close and will not update. The live page recomputes daily from the same dataset. A square version of this chart is available for feeds that crop landscape images.