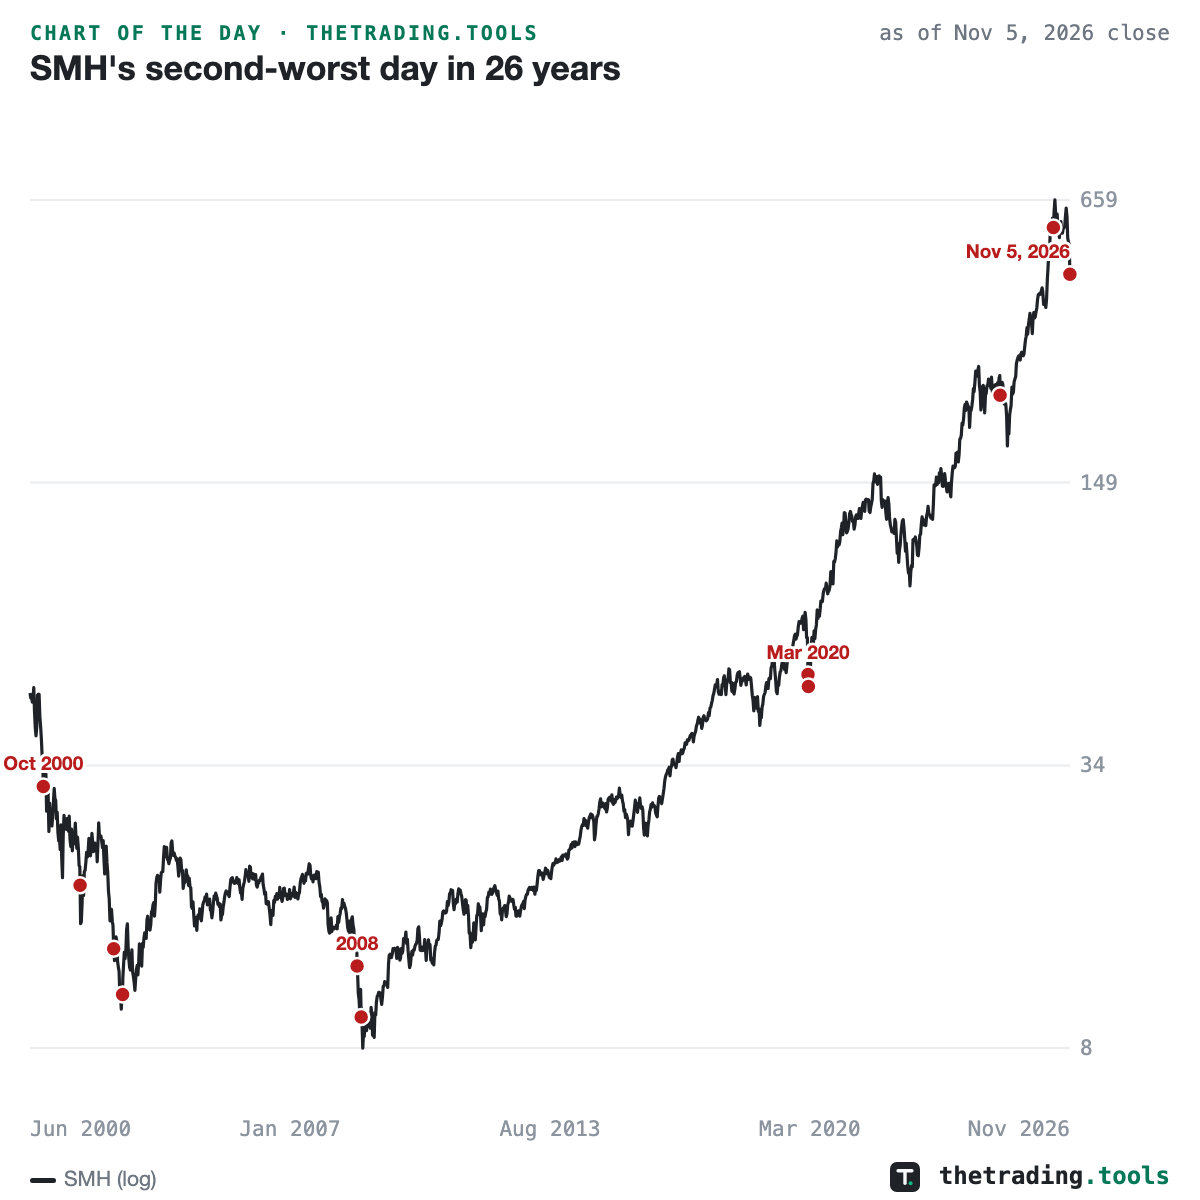
SMH fell 11.6%, its second-worst day in 26 years; the 11 sessions down 9% or more
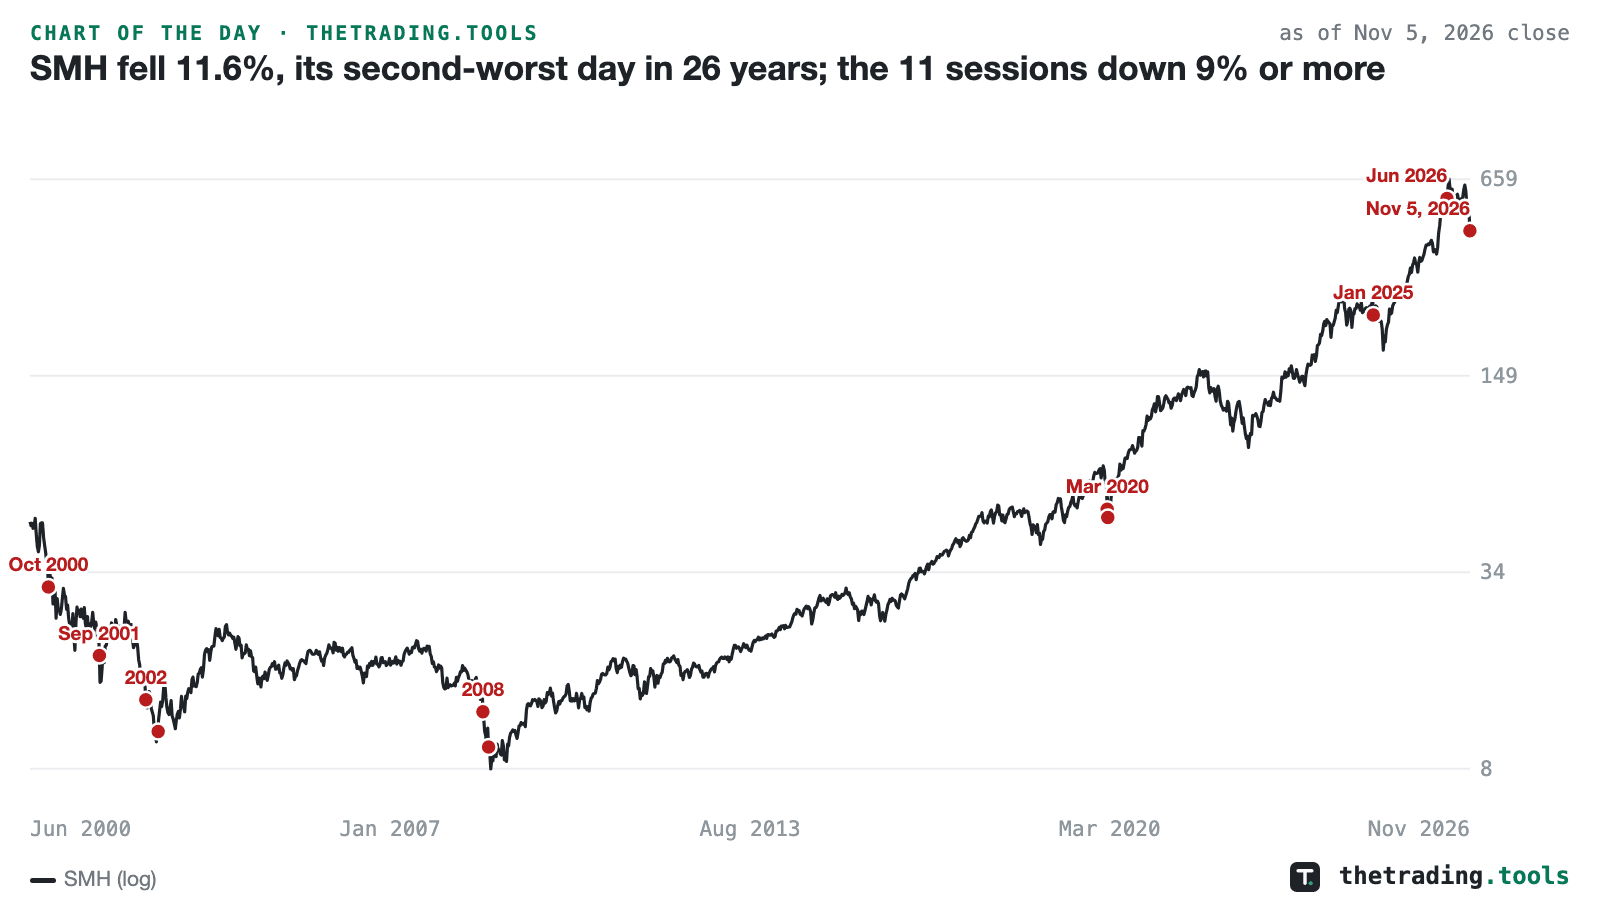
SMH closed November 5, 2026 at 445.91, down 11.6% on the session in our price file. Only one day in the fund’s record since June 2000 was worse, March 16, 2020, at 14.4%, and only three sessions lost 10% or more: March 12 and 16, 2020, and today. Eleven sessions lost 9% or more: October 10, 2000; September 17, 2001; July 25 and October 16, 2002; September 29 and November 6, 2008; March 12 and 16, 2020; January 27, 2025; June 5, 2026; and today.
Every earlier session on that list came inside one of four stretches: the 2000 to 2002 bear market, the autumn of 2008, the March 2020 crash, and the last two years, which hold three of the eleven. The chart marks them on the fund’s whole history and describes where days like this have landed; it supports no forecast. The closing price for the session differs between sources by a few tenths of a percent, and the page uses our file.
SMH dashboard — semiconductors: trend, breadth, relative strength and options, live
This chart is a frozen capture — the numbers above are as of Nov 5, 2026 close and will not update. The live page recomputes daily from the same dataset. A square version of this chart is available for feeds that crop landscape images.