Nasdaq-100 days down 5% or more while 10% to 20% below a one-year high: 13 since 1985
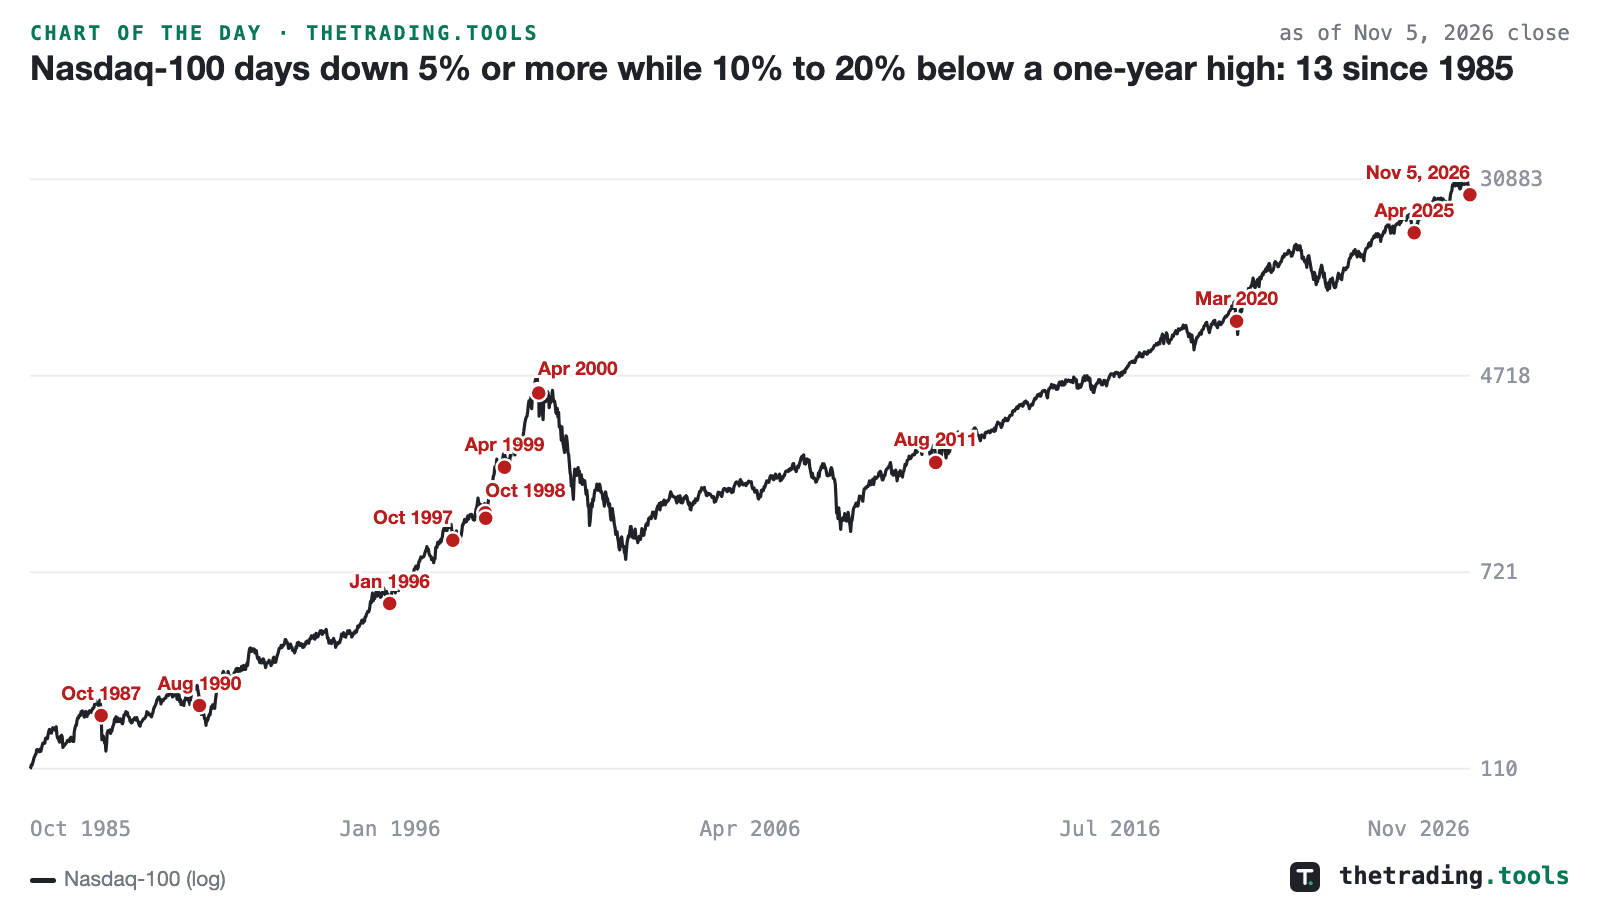
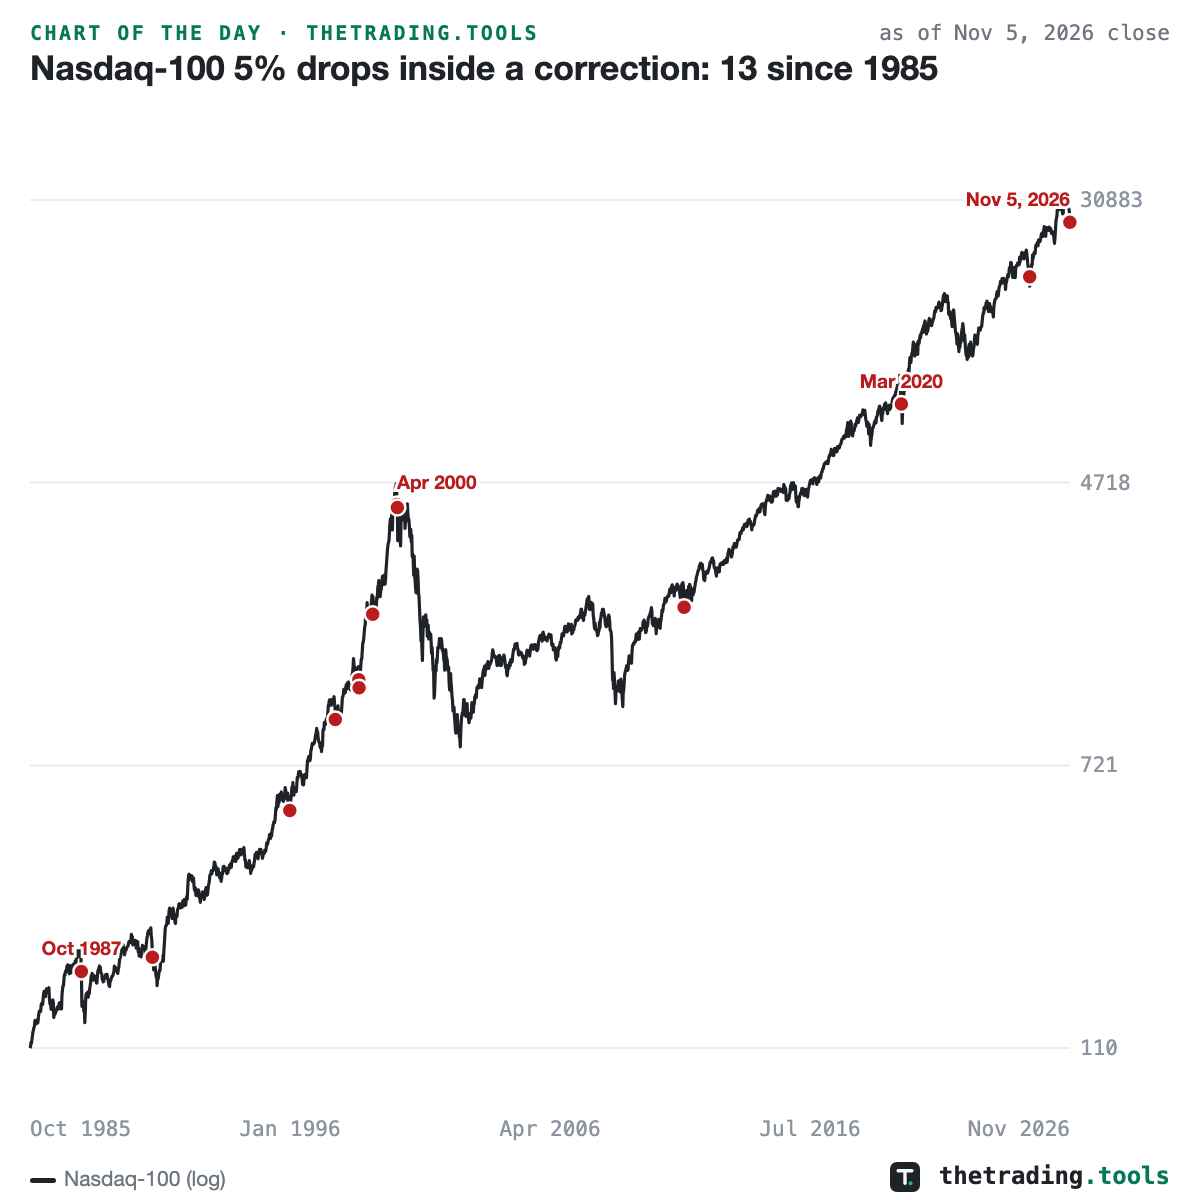
The Nasdaq-100 closed November 5, 2026 at 26,630, down 6.4% on the session, 4.8% below its 200-day average and 14.7% below its October record. Since the index’s record begins in October 1985 it has fallen 5% or more in a session 70 times, most of them deep inside the bear markets of 1987, 2000 to 2002, 2008 and 2022. Keeping only the sessions on which the close sat between 10% and 20% below the highest close of the prior year, a correction but not yet a bear market, leaves 13, today included.
Two of the twelve earlier cases were the great tops: October 16, 1987, the Friday before the crash, and the two April 2000 sessions a week apart. A year later the index was lower in all three. The other nine were nearer bottoms than tops: August 1990, January 1996, October 1997, the two October 1998 sessions, April 1999, August 2011, March 2020 and April 2025 were all higher three months on, by a median of 14.4% across the twelve, and higher a year on by a median of 36.7%. The way down came first in ten of twelve, with a lower close inside the next quarter a median 9.6% below the day’s close; 1987 went 29.9% lower and the April 2000 pair about 25%. The two nearest to today in position against the 200-day average, August 2011 and April 2025, fell a further 1.1% and 7.7% and were up 14.4% and 22.5% three months later. Twelve cases from eight episodes describe the record; they do not forecast the thirteenth.
Buy the Dip Tracker — Nasdaq-100 corrections, re-entry rules and what each did, live
This chart is a frozen capture — the numbers above are as of Nov 5, 2026 close and will not update. The live page recomputes daily from the same dataset. A square version of this chart is available for feeds that crop landscape images.