Stocks out-yield real Treasuries by 0.56 points, the thinnest margin since March 2002
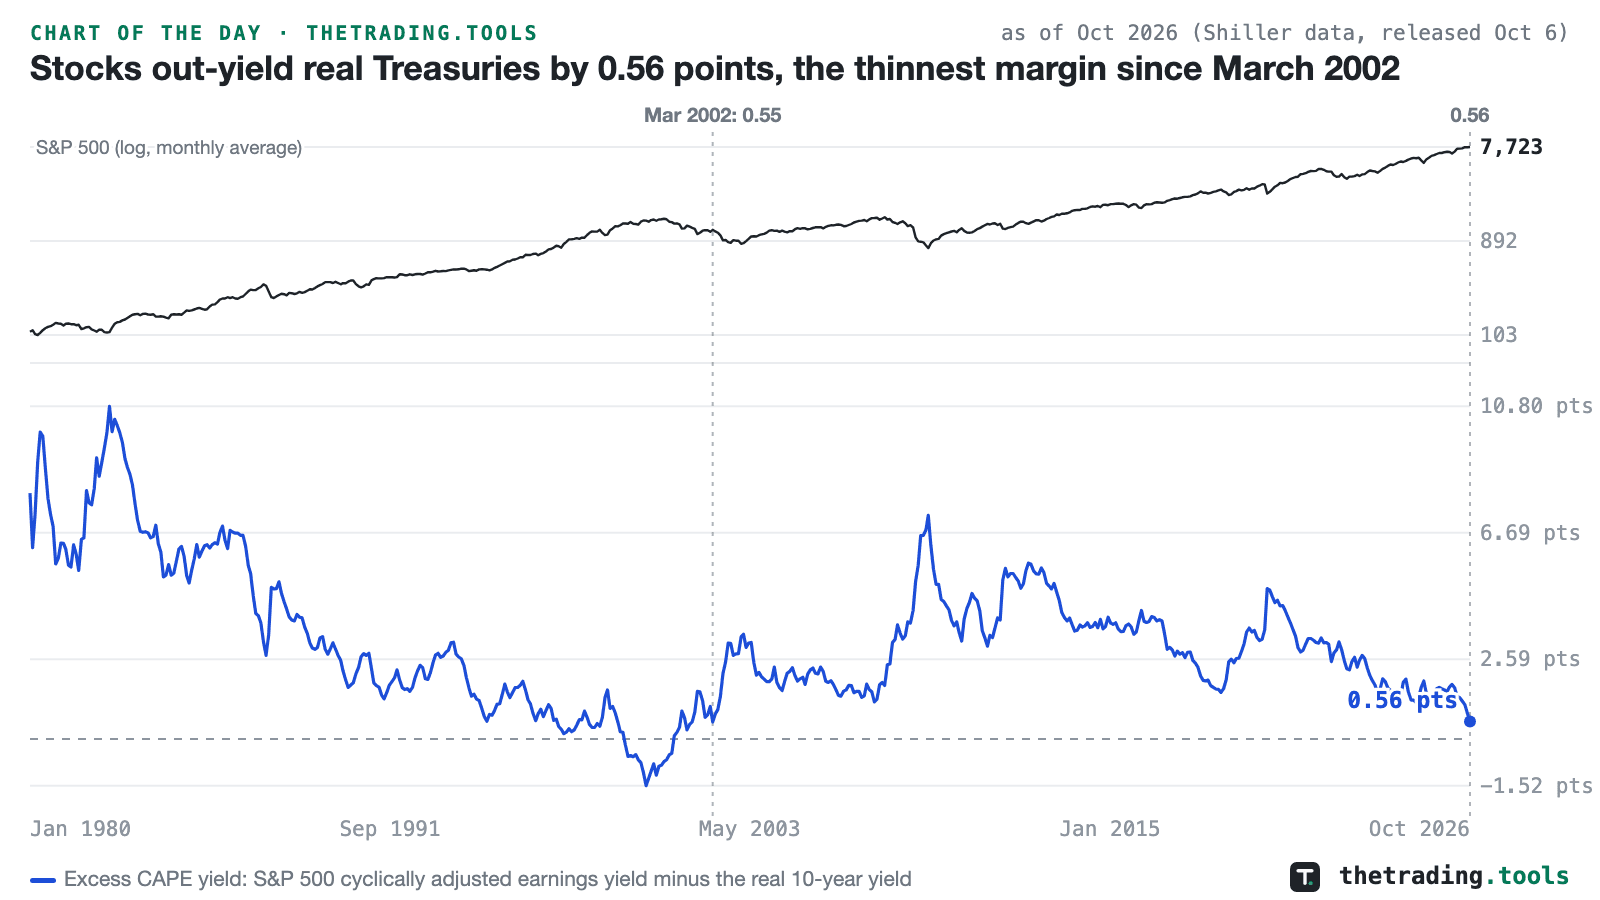
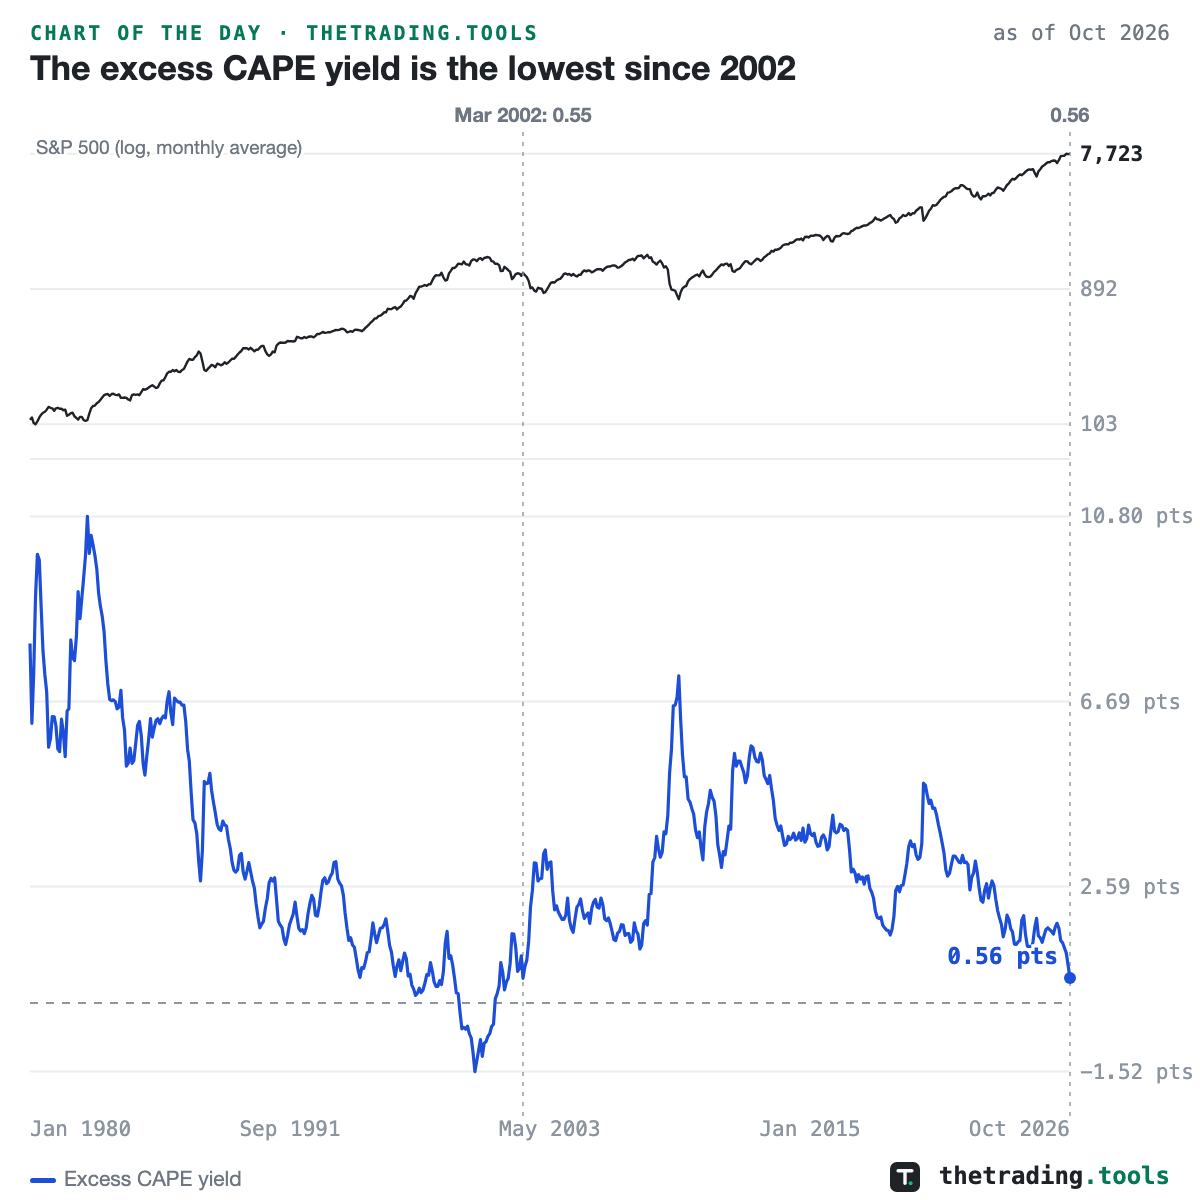
Robert Shiller’s excess CAPE yield, the cyclically adjusted earnings yield of the S&P 500 minus the real ten-year Treasury yield, was 0.56 percentage points in October 2026 (released October 6), the lowest since March 2002, when it was 0.55. Both sides moved. CAPE is 40.7, and Shiller’s long rate, 5.24%, is the highest since the same month. On the daily series the ten-year real yield closed October 30 at 2.60% after a 2026 high of 2.95% on October 5, the highest since November 2008; its 200-day average, 2.21%, is the highest since January 2008.
A thin margin is a price, and it forecasts nothing by itself. From March 2002 the S&P 500’s monthly average fell another 27% to its February 2003 low, and in January 2000 the margin was −1.52 points, below zero, months before the top. The chart shows the margin since 1980 with the S&P 500 above it; after 2008 it ranged between about 2 and 7 points and has fallen since 2021 as real yields rose faster than the earnings yield.
Shiller CAPE Ratio — CAPE, the excess CAPE yield and the long rate, live
This chart is a frozen capture — the numbers above are as of Oct 2026 (Shiller data released Oct 6; real yield to Oct 30) and will not update. The live page recomputes daily from the same dataset. A square version of this chart is available for feeds that crop landscape images.